
Journal
Vol. 29 No. 1, 2026
Table of Contents
ORIGINAL ARTICLES
Treatment Outcomes of Nasopharyngeal Carcinoma in Patients Aged 80 Years or Above
ORIGINAL ARTICLE CME
Hong Kong J Radiol 2026 Mar;29(1):e4-14 | Epub 9 March 2026
Treatment Outcomes of Nasopharyngeal Carcinoma in Patients Aged 80 Years or Above
PW Kwok, I Yeung, WWY Tin, SY Tung
Department of Clinical Oncology, Tuen Mun Hospital, Hong Kong SAR, China
Correspondence: Dr PW Kwok, Department of Clinical Oncology, Tuen Mun Hospital, Hong Kong SAR, China. Email: kwokpw@ha.org.hk
Submitted: 1 July 2025; Accepted: 18 December 2025.
Contributors: All authors designed the study. PWK and IY acquired and analysed the data. PWK drafted the manuscript. PWK, WWYT and
SYT critically revised the manuscript for important intellectual content. All authors had full access to the data, contributed to the study, approved
the final version for publication, and take responsibility for its accuracy and integrity.
Conflicts of Interest: All authors have disclosed no conflicts of interest.
Funding/Support: This research received no specific grant from any funding agency in the public, commercial, or not-for-profit sectors.
Data Availability: All data generated or analysed during the present study are available from the corresponding author on reasonable request.
Ethics Approval: This study was approved by the Central Institutional Review Board of Hospital Authority, Hong Kong (Ref No.: CIRB-2024-421-1). The requirement for informed consent was waived by the Board due to the retrospective nature of the study.
Supplementary Material: The supplementary material was provided by the authors and some information may not have been peer reviewed. Any opinions or recommendations discussed are solely those of the author(s) and are not endorsed by the Hong Kong College of Radiologists. The
Hong Kong College of Radiologists disclaims all liability and responsibility arising from any reliance placed on the content.
Abstract
Introduction
Optimal treatment for nasopharyngeal carcinoma (NPC) in patients aged 80 years or above remains
controversial due to concerns about the tolerability of radical radiotherapy (RT). This study evaluated treatment
outcomes and toxicities in octogenarians with NPC in Hong Kong.
Methods
This retrospective analysis included patients aged 80 years or above with NPC treated at a single institution
in Hong Kong between January 2009 and December 2023. Patients with distant metastases at diagnosis were
excluded. Patient characteristics, treatment outcomes, and toxicities were analysed.
Results
A total of 42 patients (median age, 83 years; range, 80-94) were included. The median follow-up duration
was 20.3 months. In the entire cohort, the median overall survival (OS) was 22.8 months (95% confidence interval
[95% CI] = 14.6-30.9) and the 5-year OS rate was 23.8%. Twenty-seven patients (64.3%) received radical RT
using intensity-modulated radiotherapy (IMRT); none received chemotherapy. Among these patients (Cohort A),
the median OS was 41.3 months (95% CI = 27.7-55.0), while the 5-year OS and cancer-specific survival rates were
38.1% and 74.2%, respectively. Grade ≥3 acute toxicities occurred in 22.2% of patients; one patient (3.7%) died
due to treatment-related toxicity. Treatment failure occurred in five patients (18.5%), all due to distant metastases.
Among patients who received non-radical RT (Cohort B), the median OS was 12.8 months (95% CI = 10.9-14.7),
and none survived beyond 5 years. Most deaths in Cohort A (57.9%) were unrelated to NPC, whereas the majority
in Cohort B (66.7%) were NPC-related.
Conclusion
In appropriately selected patients aged 80 years or above with NPC, radical RT using modern IMRT
techniques is a viable treatment option, offering reasonable survival outcomes and an acceptable toxicity profile.
Chronological age alone should not be regarded as a barrier to radical treatment in NPC.
Key Words: Nasopharyngeal carcinoma; Octogenarians; Radiotherapy
中文摘要
80歲或以上鼻咽癌患者的治療結果
郭伯維、楊溢、佃穎恩、董煜
引言
對於年滿80歲或以上的鼻咽癌患者,其最佳治療方案仍具爭議,主要源於對根治性放射治療耐受性的顧慮。本研究旨在評估本港80歲或以上鼻咽癌患者的治療成效及相關毒性。
方法
本回顧性研究分析一所醫院於2009年1月至2023年12月期間治療的80歲或以上鼻咽癌患者資料。診斷時已出現遠處轉移者予以排除。研究分析內容包括患者特徵、治療成效及毒性情況。
結果
本研究共納入42名患者(年齡中位數83歲,介乎80至94歲),中位隨訪時間為20.3個月。整體患者的中位總生存期為22.8個月(95%置信區間:14.6-30.9),5年總生存率為23.8%。其中27名患者(64.3%)接受以調強放射治療進行的根治性放療,無人接受化療。在該組患者(A組)中,中位總生存期為41.3個月(95%置信區間:27.7-55.0),5年總生存率及癌症特異性生存率分別為38.1%及74.2%。3級或以上急性毒性發生率為22.2%;1名患者(3.7%)因治療相關毒性死亡。共有5名患者(18.5%)出現治療失敗,均為遠處轉移所致。接受非根治性放療的患者(B組)其中位總生存期為12.8個月(95%置信區間:10.9-14.7),且無人存活超過5年。A組多數死亡個案(57.9%)與鼻咽癌無關,而B組大多數死亡個案(66.7%)則與鼻咽癌相關。
結論
對於經審慎篩選的80歲或以上鼻咽癌患者,採用現代調強放射治療技術進行根治性放療屬可行治療選項,可帶來合理的生存成效及可接受的毒性水平。年齡本身不應被視為接受根治性治療的障礙。
INTRODUCTION
Nasopharyngeal carcinoma (NPC) is an epithelial
carcinoma originating from the nasopharyngeal mucosa.
This malignancy is most prevalent in Asia, accounting
for over 80% of global incident cases in 2022.[1] In
endemic regions, NPC incidence peaks in the 45-59
years age-group and declines thereafter.[2] Data from
the Hong Kong Cancer Registry indicate that in 2023,
approximately 4.9% of new NPC cases occurred in
patients aged 80 years or above.[3]
Standard treatment for NPC involves high-dose radical
radiotherapy (RT) of 66 to 70 Gy, often combined with
concurrent, induction, and/or adjuvant chemotherapy for
locally advanced disease.[4] [5] However, these treatment
guidelines are largely based on clinical studies that have
underrepresented or excluded older adult populations.
For instance, in a meta-analysis of chemotherapy in NPC,
only 13% of the cohort was aged 60 years or above.[6]
Older adults with NPC have worse survival outcomes
compared to their younger counterparts.[5] Previous
studies have reported 5-year overall survival (OS) rates ranging from 44% to 60% among patients aged
70 years or above with NPC,[7] [8] [9] whereas those aged 80
years or above exhibit a considerably lower survival
rate of approximately 30%.[10] Treating older adults with
NPC presents particular challenges due to increased co-morbidities,
nutritional issues, organ dysfunction, and
greater susceptibility to treatment-related toxicities.[11]
Despite these clinical challenges, studies specifically
addressing treatment outcomes and strategies in
older adults with NPC remain limited. Furthermore,
inconsistencies exist regarding the definition of ‘older
adults’ or ‘elderly’ across published studies, with age
thresholds typically ranging from 65 to 70 years.[7] [8] [9] [10] [12] [13] Notably, outcomes for the oldest patients with NPC,
specifically those aged 80 years or above, are rarely
reported. These much older patients may represent a
distinct subgroup, even within the broader geriatric
population. Huang et al[10] reported that patients aged
80 years or above with NPC had significantly worse
survival than those aged 65 to 69 years. This study aimed
to investigate treatment patterns and survival outcomes
in older adults aged 80 years or above with NPC in Hong
Kong.
METHODS
Patient Characteristics
We conducted a retrospective review of the medical
records of patients with NPC who received care at Tuen
Mun Hospital between 1 January 2009 and 31 December
2023. Patients aged 80 years or above at diagnosis with
histologically confirmed NPC were included. Those with
distant metastasis at initial diagnosis were excluded.
Data on demographics, disease status, co-morbidities,
and treatment outcomes were retrieved from electronic
patient records and analysed. Patients were categorised
into those who received radical RT to the nasopharynx
(Cohort A) and those who did not (Cohort B).
Staging and Evaluation
Patients underwent clinical evaluation, including history
taking and physical examination. Local and regional
staging was performed using magnetic resonance
imaging of the nasopharynx and neck and/or computed
tomography. Between 2009 and 2017, positron emission
tomography–computed tomography (PET-CT) was
selectively performed in patients with symptoms,
laboratory abnormalities, or chest radiograph findings
suggestive of distant metastasis. From 2018 onwards,
PET-CT has been routinely performed for all patients
with tumour (T) stage T4, nodal (N) stage N3, or T3N2
disease, as well as those with clinical suspicion of
metastatic disease, in accordance with Hospital Authority
(HA) standard indications.
NPC staging was performed according to the 8th
edition of the American Joint Committee on Cancer
(AJCC) staging manual.[14] Patients diagnosed prior to the
introduction of the AJCC 8th edition were retrospectively
re-staged. Patient performance status was assessed using
the Karnofsky Performance Status (KPS) Scale.[15] Co-morbidities
and overall health status were retrospectively
evaluated using the Adult Comorbidity Evaluation–27
(ACE-27),[16] the Charlson Comorbidity Index (CCI),[17]
and the modified Frailty Index–11 (mFI-11).[18]
Radiotherapy
All patients who received radical RT underwent
intensity-modulated radiotherapy (IMRT). Patients were
immobilised in the supine position using a thermoplastic
cast applied to the head and shoulders. A non-contrast
simulation computed tomography scan was acquired and
fused with the diagnostic magnetic resonance imaging
scan. Target volumes were contoured according to
international guidelines.[19] [20] The gross tumour volume
encompassed the primary tumour and enlarged lymph nodes. Clinical target volumes (CTVs) were defined
as high-risk, intermediate-risk, and low-risk CTVs.
The high-risk CTV included the gross tumour volume
plus a 5-mm margin and the whole nasopharynx. The
intermediate-risk CTV included the high-risk CTV
plus a 5-mm margin and was expanded to cover sites at
risk of microscopic extension, as well as the involved
nodal levels. The low-risk CTV included uninvolved
but potentially at-risk nodal levels. Prescribed doses to
the high-, intermediate-, and low-risk CTVs were 70
Gy, 60 Gy, and 54 Gy, respectively, delivered in 33
daily fractions using the simultaneous integrated boost
technique. A 3-mm margin from CTV to planning target
volume was added to account for setup uncertainty. The
planning target volume was subsequently cropped 3 mm
from the external body contour, and midline avoidance
structures were created to minimise skin and mucosal
toxicities.
Treatment Evaluation and Follow-up
Patients undergoing radical RT were monitored
weekly during treatment. RT-related toxicities were
prospectively recorded and graded according to the
National Cancer Institute Common Terminology
Criteria for Adverse Events, version 5.0.[21] Treatment
response evaluations were conducted 8 to 12 weeks after
completion of RT and included physical examination
and nasopharyngoscopy. For patients treated after 2021,
routine magnetic resonance imaging of the nasopharynx
and neck was also performed in addition to physical
examination and nasopharyngoscopy. Patients were
subsequently followed up at regular 3- to 6-month
intervals by oncologists and otolaryngologists. Each visit
included a clinical examination and nasopharyngoscopy.
Further investigations (e.g., imaging and blood tests)
were performed when recurrence was suspected.
Cause-of-Death Analysis
Causes of death were determined from electronic
medical records and classified into four categories: (1)
NPC-related death, defined as death resulting from the
primary NPC or its metastases; (2) treatment-related
death, defined as death due to complications arising from
NPC treatment; (3) non-NPC death, defined as death
from causes unrelated to the cancer or its treatment; and
(4) unknown, defined as death for which a definitive
cause could not be established based on the available
clinical information. Classification as NPC-related
death required the terminal event to be attributable to
metastatic disease or to a documented complication
of symptomatic or progressive local disease. When competing causes were present, the primary cause was
determined based on clinical documentation, imaging
findings, and its temporal relationship to treatment.
For example, aspiration pneumonia occurring with
documented dysphagia secondary to progressive local
NPC was classified as an NPC-related death, whereas
aspiration pneumonia in the absence of documented
treatment-related dysphagia or residual tumour was
classified as a non-NPC death.
Statistical Analyses
OS was defined as the interval from the date of
histological diagnosis to the date of death. Progression-free
survival was defined as the interval from histological
diagnosis to the date of disease progression (including
local, regional, or distant progression) or death. Cancer-specific
survival (CSS) was defined as the interval from
histological diagnosis to the date of NPC-related death.
Survival rates were estimated using the Kaplan–Meier
method. Univariable and multivariable Cox proportional
hazards regression models were used to identify factors
associated with survival. Variables with p < 0.05 in
univariable analysis and those deemed clinically relevant
were considered for multivariable modelling. To reduce
multicollinearity, closely related clinical variables
were not included simultaneously in the multivariable
model, such as individual TNM (tumour-nodal-metastatic) components and overall
stage or measures of performance status and frailty.
Hazard ratios (HRs) with 95% confidence intervals
(95% CIs) were reported. The Mann–Whitney U test
was used to compare distributions of ordinal variables
between patient cohorts. For categorical variables, the
Chi squared test or Fisher’s exact test was applied, as
appropriate. All statistical tests were two-sided, with a
significance threshold of p < 0.05. Statistical analyses
were performed using SPSS (Windows version 26.0;
IBM Corp, Armonk [NY], United States).
RESULTS
Patient Characteristics and Treatment
In total, 42 patients were included. Patient characteristics are summarised in Table 1. The median age was 83
years (range, 80-94) and 29 patients (69.0%) were men.
Most patients presented with stage III disease (33.3%),
followed by stage II (26.2%), stage IVa (19.0%), and
stage I (11.9%). A higher proportion of patients in Cohort
A underwent PET-CT for distant metastasis screening
compared with Cohort B (29.6% vs. 6.7%). Staging
information was unavailable for four patients (9.5%), all
of whom were in Cohort B.
Table 1. Baseline patient and disease characteristics.

Overall, 27 patients (64.3%) received radical RT to the
nasopharynx (Cohort A), while 15 patients (35.7%) did
not (Cohort B) [Table 1]. Reasons for not undergoing
radical RT included patient refusal (n = 9), concomitant
malignancy (n = 1), and medical unfitness for radical
treatment (n = 5). Of the 15 patients in Cohort B, two
(13.3%) received palliative RT. Chemotherapy was not
administered to any patients in either cohort.
Cohort A had significantly more patients with a KPS
score ≥70% compared with Cohort B. No significant
differences were observed in ACE-27 scores or CCI
scores. Although a higher proportion of patients in
Cohort B had a mFI-11 score ≥0.27 (categorised as
frail) compared with Cohort A, this difference was not
statistically significant (Table 1).
Survival Outcome and Prognostic Factors
At the time of analysis, eight patients (19.0%) were alive.
The median follow-up duration was 20.3 months (range,
1.5-138) for the entire cohort, and 28.2 months for
those who were alive. The median OS was 22.8 months
(95% CI = 14.6-30.9).
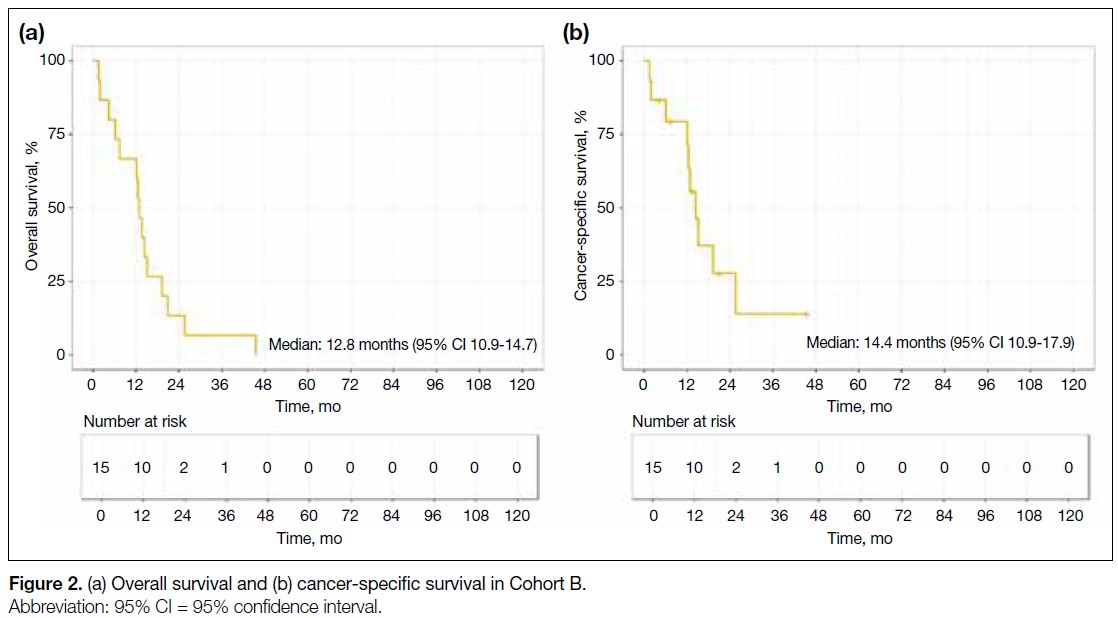
Among patients who received radical RT (Cohort A), the
median OS was 41.3 months (95% CI = 27.7-55.0). The
median CSS was not reached. The median progression-free
survival was 39.6 months (95% CI = 22.4-56.7).
The 5-year OS and CSS rates were 38.1% and 74.2%,
respectively (Figure 1).
Figure 1. (a) Overall survival and (b) cancer-specific survival in Cohort A.

Among patients who did not receive radical RT (Cohort
B), the median OS was 12.8 months (95% CI = 10.9-14.7) and the median CSS was 14.4 months (95% CI = 10.9-17.9). No patient in Cohort B survived to 5 years
(Figure 2).
Figure 2. (a) Overall survival and (b) cancer-specific survival in Cohort B.
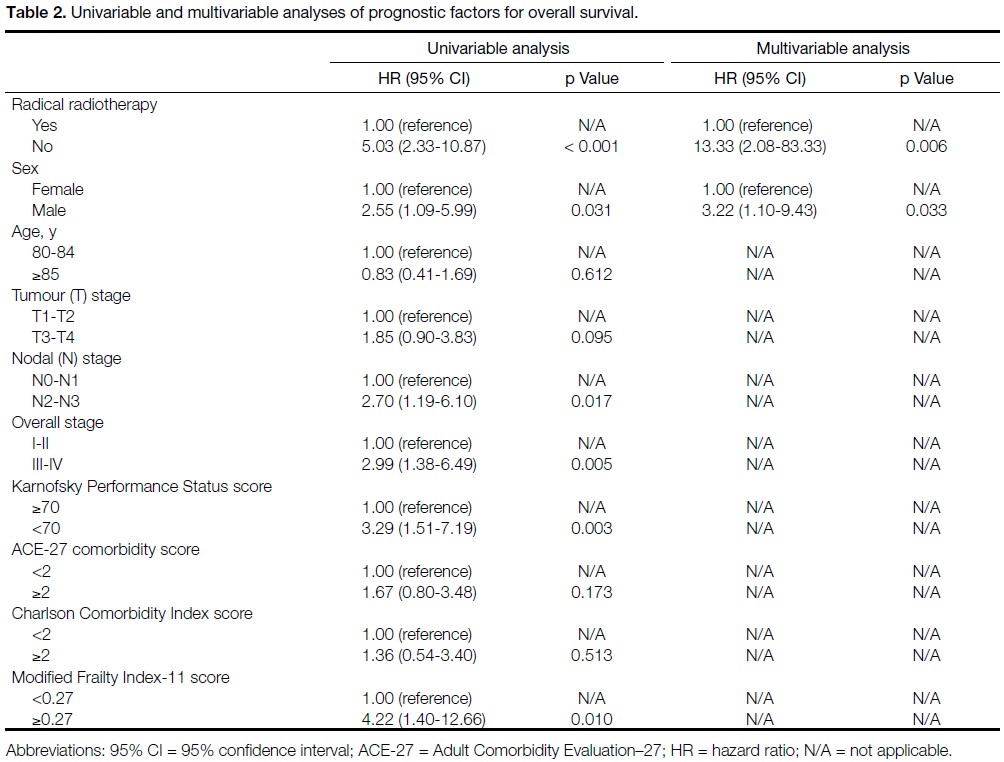
Univariable analysis identified several factors
significantly associated with worse OS, including
absence of radical RT (no vs. yes; HR = 5.03, p < 0.001),
male sex (male vs. female; HR = 2.55, p = 0.031),
advanced nodal stage (N2-3 vs. N0-N1; HR = 2.70,
p = 0.017), advanced overall AJCC stage (stage III-IV vs.
stage I-II; HR = 2.99, p = 0.005), poor KPS score (<70%
vs. ≥70%; HR = 3.29, p = 0.003), and frailty based on the
mFI-11 (mFI-11 score ≥0.27 vs. <0.27; HR = 4.22, p = 0.010).
On multivariable analysis, no receipt of radical RT
(HR = 13.33; p = 0.006) and male sex (HR = 3.22; p = 0.033) were independently associated with worse OS
(Table 2).
Table 2. Univariable and multivariable analyses of prognostic factors for overall survival.
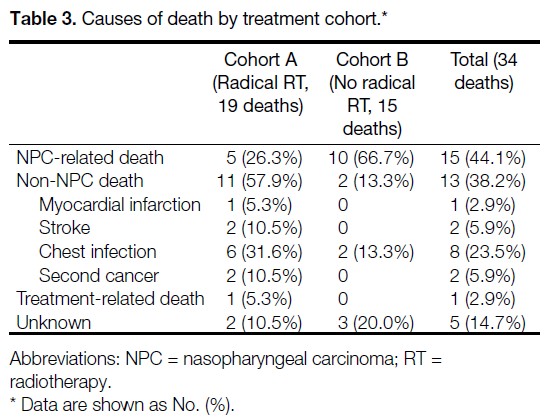
Cause-of-Death Analysis
Among the 34 patients who died, the most common
cause of death was NPC-related death (n = 15, 44.1%),
followed by non-NPC death (n = 13, 38.2%). Treatment-related
mortality occurred in one patient (2.9% of
deaths), and the cause of death was unknown in five patients (14.7%). The causes of death among patients
who underwent radical RT (Cohort A) and those who
did not (Cohort B) are summarised in Table 3. The two
cohorts demonstrated distinct cause-of-death profiles. In
Cohort A, the most common cause of death was non-NPC death (n = 11, 57.9%), followed by NPC-related death (n = 5, 26.3%), unknown causes (n = 2, 10.5%),
and treatment-related death (n = 1, 5.3%). Among
patients in Cohort A who died of non-NPC causes, the
median interval from the last day of RT to death was
36.9 months (interquartile range, 16.1-71.0). In Cohort B, the majority of patients died of NPC-related causes
(n = 10, 66.7%); two patients (13.3%) died of non-NPC
causes and three patients (20%) died of unknown causes.
Detailed descriptions of the circumstances of death for
individual cases are provided in the online supplementary Table.
Table 3. Causes of death by treatment cohort.
Radical Radiotherapy
Treatment Outcomes
Among the 27 patients in Cohort A who underwent
radical RT, the majority (96.3%) completed the planned
course of treatment. Local treatment response to RT was
documented in 22 patients; of these, 95.5% achieved a
complete response. One patient had persistent disease
in the nasopharynx and achieved successful salvage
with brachytherapy. No local or regional relapse was
observed. Five patients (18.5%) developed distant
recurrence, with a median time to onset of distant
metastasis of 17.6 months (range, 8.3-34.0). None of
these patients received further systemic anticancer
therapy for metastatic disease.
Acute and Late Treatment Toxicities
Table 4 summarises the acute toxicities observed in
Cohort A. Grade ≥3 acute RT toxicities, defined as
those occurring during RT or within 3 months after
RT, were observed in six of 27 patients (22.2%). The most frequently reported acute toxicities were mucositis
(all grades, 96.3%; grade ≥3, 14.8%) and radiation
dermatitis (all grades, 77.8%; grade ≥3, 3.7%). Seven
patients (25.9%) required unplanned hospital admission during treatment: four for grade 3 mucositis, one for
grade 3 dermatitis, one for feeding tube insertion to
support nutrition in the absence of clinically significant
mucositis, and one for a chest infection during the sixth
RT fraction (this patient subsequently died). The fatal
chest infection resulted in a treatment-related mortality
rate of 3.7%. Two patients (7.4%) died within 90 days of
completing RT.
Table 4. Acute treatment-related toxicities in Cohort A (n = 27).

Grade ≥3 late RT toxicities (defined as those occurring
more than 3 months after RT) were observed in 14.8% of
patients, the majority of which involved severe hearing
loss. One patient (3.7%) required long-term feeding tube
support due to dysphagia.
DISCUSSION
In this retrospective study of patients aged 80 years or
above with NPC, radical RT using IMRT resulted in
a median OS of 41.3 months and a 5-year OS rate of
38.1%, with manageable toxicity. To our knowledge,
this is the first study to specifically evaluate treatment
outcomes and toxicities in this group of patients, thereby
addressing a critical knowledge gap.
The treatment of NPC in older adults is challenging
and frequently overlooked, as this population is
often excluded from or underrepresented in clinical
trials. Older adults represent a heterogeneous group
characterised by a wide range of co-morbidities and
varying degrees of frailty. Management of NPC in
this group is often complex, and survival outcomes are
generally worse compared with those of their younger
counterparts.
Yang et al[8] reported outcomes in patients aged 70
years or above with NPC, most of whom received RT
combined with chemotherapy, achieving a 5-year OS rate of 59.5%. Notably, only 65.3% of patients in that
cohort received IMRT, and most were younger than 75
years.[8] Jin et al[7] examined a similar cohort of patients
aged 70 years or above with NPC who were treated
exclusively with IMRT and reported a 5-year OS rate
of 54%; however, chemotherapy was administered to
42.8% of patients, and the maximum age in that cohort
was 73 years. Patients aged 80 years or above represent
an especially challenging subgroup, even within the
broader geriatric population. In a National Cancer
Database analysis by Huang et al,[10] patients aged 80
years or above with NPC who received radical RT had
a 5-year OS rate of 31.3%. Toxicity outcomes were not
reported in that study.
Due to prevalent co-morbidities and reduced bone
marrow reserve, older patients with NPC often
have limited tolerance for chemotherapy, whether
administered as induction therapy or concurrently with
RT. The benefit of chemotherapy in this population
remains a subject of debate. While some retrospective
studies have reported improved outcomes with the
addition of chemotherapy to RT in older adults,[12] [22] [23]
others have shown no clear survival advantage.[7] [24] [25] In
clinical practice, chemotherapy is seldom administered
to patients aged 80 years or above.[8] Indeed, in our cohort,
no patient in this age-group received chemotherapy.
High-dose RT to the head and neck region can be
potentially morbid, and treatment tolerance is a
significant concern, particularly among older adults. A
study by Sze et al[9] reported significantly higher rates of
acute grade 3 toxicities, RT incompletion, and 90-day
mortality in patients aged 70 years or above with NPC
compared with younger patients. As a result, clinicians
may be hesitant to offer radical RT to patients aged 80
years or above.
Our findings demonstrated that radical RT is associated
with meaningful survival outcomes in patients aged 80
years or above. Among those who received radical RT,
a median OS exceeding 3 years and a 5-year OS rate of
38.1% are encouraging, suggesting that radical RT can
provide reasonable survival even for octogenarians.
Our study also showed that patients who did not receive
radical RT had poorer outcomes, with a median OS of
only 12.8 months. However, direct survival comparisons
between these two cohorts should be interpreted with
caution due to important baseline differences. Patients
in Cohort B had significantly worse performance status, with a greater proportion exhibiting a KPS score below
70 compared with Cohort A. Although no significant
differences were observed between cohorts in terms of
co-morbidity indices, inherent disparities undoubtedly
existed. These differences may introduce confounding
bias, whereby the observed survival advantage of
radical RT may be partially attributable to baseline
patient characteristics. Despite these limitations, the
considerable difference in outcomes suggests a potential
benefit of radical RT in appropriately selected older
adults.
Perhaps more importantly, the cause-of-death analysis
offers additional insight into the potential benefit of
radical RT. Among patients who received radical RT,
most deaths were due to medical conditions unrelated
to NPC or its treatment, whereas in the non-radical RT
group, the majority of deaths were attributable to NPC
progression.
These findings may assist clinicians in discussions
with patients and caregivers, facilitating personalised
management strategies. It is important for clinicians
to recognise the potential benefits of radical RT in
appropriately selected patients, ensuring that advanced
age alone does not preclude access to potentially curative
treatment.
IMRT has become the standard of care for NPC, providing
optimal tumour coverage while sparing critical organs
at risk.[26] It is associated with improved tumour control
and a reduction in both acute and late toxicities.[27] [28] In
our study, however, grade ≥3 acute toxicities remained
common (22.2%) among patients undergoing radical RT
with IMRT. It is important to recognise that older adults
are at increased risk of developing severe treatment-related
toxicities; all toxicities should be identified
promptly and managed proactively. In particular,
RT-induced mucositis and dysphagia can lead to life-threatening
infectious complications, as demonstrated
by the single grade 5 toxicity observed in our cohort.
Intensive clinical monitoring throughout treatment—combined with appropriate supportive medications
and multidisciplinary collaboration involving nurses,
dietitians, and speech therapists—is essential. Vigilance
in nutritional management is particularly important, as
older adults may already be at high risk of sarcopenia and
have limited physiological reserves.[29] Clinicians should
maintain a low threshold for feeding tube insertion
during RT, and a prophylactic approach to nutritional
support may be considered.
Although the incidence of grade ≥3 acute toxicities was
relatively high, it was not prohibitive. In our study, the
rates of grade ≥3 dermatitis and mucositis were 3.7%
and 14.8%, respectively, both of which appear lower
than previously reported figures of 21.6% to 22.3%
for grade ≥3 dermatitis and 18.9% to 68% for grade ≥3
mucositis.[9] [25] This difference is likely attributable to our
institutional protocol, which routinely includes a 3-mm
skin clip and the creation of midline structure avoidance
volumes. In the present study, the treatment-related
mortality rate was 3.7% and the 90-day mortality rate
was 7.4%, a figure comparable to the 7.8% reported by
Sze et al[9] in patients aged above 70 years.
Late grade ≥3 RT toxicities were also infrequent in
our study; only one patient remained dependent on a
feeding tube. This observation may be partly explained
by the relatively short follow-up period and limited
survival duration, which may have precluded the full
manifestation of late toxicities. Another contributing
factor is that all patients received IMRT, which delivers
a more conformal dose distribution to the target volume
while better sparing adjacent normal tissues.[30]
Although this study focuses on patients aged 80 years
or above, it is essential for clinicians to recognise that
chronological age alone should not serve as the sole
criterion for risk stratification. Co-morbidity and frailty
assessments provide critical information to guide the
management of older patients with NPC. Comprehensive
geriatric assessment, considered the gold standard for
evaluating older adults, is recommended by both the
International Society of Geriatric Oncology[31] and the
American Society of Clinical Oncology[32] to support
treatment decision making. However, comprehensive
geriatric assessment is not widely implemented due to
its time-consuming nature. Several tools are available
for co-morbidity assessment, including the CCI,[17] the
ACE-27,[16] and the mFI-11.[18] Notably, both ACE-27
and CCI have been associated with survival outcomes.
For example, Huang et al[10] identified CCI score ≥2 was
an independent prognostic factor for mortality, while
higher ACE-27 scores have been associated with poorer
survival outcomes.[7] [9] [33] In our study, there was a trend
towards worse survival outcomes in patients with higher
CCI, ACE-27, and mFI-11 scores; however, none of
these associations reached statistical significance in
multivariable analysis, likely due to the small sample
size.
Several questions remain unanswered. Although radical RT of 70 Gy remains the current standard of care,[4]
it is unclear whether this ‘one-size-fits-all’ approach
is appropriate for older adults with NPC. A logical
consideration is RT dose de-escalation, aiming to balance
optimal tumour control with minimised toxicity. Wang
et al[34] demonstrated comparable outcomes between
standard-dose RT (70 Gy) and reduced-dose RT (53-67
Gy) in patients with T1 to T3 NPC. However, there is
currently no robust evidence supporting RT dose de-escalation
specifically in older adults with NPC. Future
studies are warranted to explore the optimal dose and
fractionation schedules for this population.
Strengths and Limitations
This study has several strengths. To our knowledge, it
is the first to specifically report treatment outcomes and
toxicities in patients aged 80 years or above with NPC.
All treatments were delivered using modern IMRT
techniques, and acute and late treatment-related adverse
events were prospective documented.
This study has several important limitations. First,
inherent selection bias exists in this retrospective cohort
comparison, as patients who received radical RT were
likely to have been healthier overall, despite similar co-morbidity
scores, and treatment decisions were influenced
by unmeasured factors, including clinician judgement
and patient preference. Second, comprehensive screening
for distant metastases was not performed in some
patients, particularly those who did not receive radical
RT. It is therefore possible that a higher proportion of
patients in Cohort B had undiagnosed stage IVb disease
at presentation, which may have contributed to poorer
outcomes. Third, the relatively small sample size limits
the statistical power of the analysis and precludes the
application of more sophisticated statistical methods,
such as causal inference approaches (e.g., propensity
score matching). Fourth, the follow-up duration was
relatively short and some late toxicities may not yet have
emerged. Fifth, formal geriatric assessments (such as
comprehensive geriatric assessment) and quality-of-life
evaluations were not conducted. Prospective multicentre
studies with larger sample sizes, standardised geriatric
assessments, and quality-of-life measurements are
warranted to validate these findings and better inform
clinical practice.
CONCLUSION
In appropriately selected patients aged 80 years or above
with NPC, radical RT using modern IMRT techniques
represents a viable treatment option, offering reasonable survival outcomes with an acceptable toxicity profile.
Chronological age alone should not be regarded as a
barrier to radical treatment in NPC.
REFERENCES
1. Ferlay J, Ervik M, Lam F, Laversanne M, Colombet M, Mery L, et al. Nasopharyngeal cancer statistics. Global Cancer Observatory: Cancer Today. 2024. Available from: https://gco.iarc.who.int/media/globocan/factsheets/cancers/4-nasopharynx-fact-sheet.pdf. Accessed 9 Feb 2026.
2. Chang ET, Ye W, Zeng YX, Adami HO. The evolving epidemiology of nasopharyngeal carcinoma. Cancer Epidemiol Biomarkers Prev. 2021;30:1035–47.
Crossref
3. Hospital Authority. Hong Kong Cancer Registry. Cancer statistics query system (All ages). Available from: https://www3.ha.org.hk/cancereg/allages.asp. Accessed 9 Feb 2025.
4. Lee VH, Lam KO, Lee AW. Chapter 10—Standard of Care for Nasopharyngeal Carcinoma (2018–2020). In: Lee AW, Lung ML, Ng WT, editors. Nasopharyngeal Carcinoma: From Etiology to Clinical Practice. London: Academic Press; 2019: 205–38.
Crossref
5. Bossi P, Chan AT, Licitra L, Trama A, Orlandi E, Hui EP, et al. Nasopharyngeal carcinoma: ESMO–EURACAN Clinical Practice Guidelines for diagnosis, treatment and follow-up. Ann Oncol. 2021;32:452–65.
Crossref
6. Blanchard P, Lee A, Marguet S, Leclercq J, Ng WT, Ma J, et al. Chemotherapy and radiotherapy in nasopharyngeal carcinoma: an update of the MAC–NPC meta-analysis. Lancet Oncol. 2015;16:645–55.
Crossref
7. Jin YN, Zhang WJ, Cai XY, Li MS, Lawrence WR, Wang SY, et al. The characteristics and survival outcomes in patients aged 70 years and older with nasopharyngeal carcinoma in the intensity-modulated radiotherapy era. Cancer Res Treat. 2019;51:34–42.
Crossref
8. Yang G, Huang J, Sun J, Wang L. Elderly nasopharyngeal carcinoma patients (aged ≥70 years): survival and treatment strategies. Cancer Med. 2023;12:19523–9.
Crossref
9. Sze HC, Ng WT, Chan OS, Shum TC, Chan LL, Lee AW. Radical radiotherapy for nasopharyngeal carcinoma in elderly patients: the importance of co-morbidity assessment. Oral Oncol. 2012;48:162–7.
Crossref
10. Huang Y, Chen W, Haque W, Verma V, Xing Y, Teh BS, et al. The impact of comorbidity on overall survival in elderly nasopharyngeal carcinoma patients: a National Cancer Data Base analysis. Cancer Med. 2018;7:1093–101.
Crossref
11. Mascarella MA, Vendra V, Sultanem K, Tsien C, Shenouda G, Sridharan S, et al. Predicting short-term treatment toxicity in head and neck cancer through a systematic review and meta-analysis. J Geriatr Oncol. 2024;15:102064.
Crossref
12. Liu H, Chen QY, Guo L, Tang LQ, Mo HY, Zhong ZL, et al. Feasibility and efficacy of chemoradiotherapy for elderly patients
with locoregionally advanced nasopharyngeal carcinoma: results
from a matched cohort analysis. Radiat Oncol. 2013;8:70.
Crossref
13. Wen YF, Sun XS, Yuan L, Zeng LS, Guo SS, Liu LT, et al. The impact of Adult Comorbidity Evaluation–27 on the clinical
outcome of elderly nasopharyngeal carcinoma patients treated with
chemoradiotherapy or radiotherapy: a matched cohort analysis. J Cancer. 2019;10:5614–21.
Crossref
14. Amin MB, Edge S, Greene F, Byrd DR, Brookland RK, Washington MK, et al (eds). AJCC Cancer Staging Manual. 8th ed. New York: Springer; 2017.
15. MDCalc. Karnofsky Performance Status Scale. Available from: https://www.mdcalc.com/calc/3168/karnofsky-performance-status-scale. Accessed 6 Feb 2026.
16. British Geriatrics Society. Adult Comorbidity Evaluation–27. Available from: https://www.bgs.org.uk/sites/default/files/content/attachment/2018-07-05/adult_comorbidity_evaluation.pdf. Accessed 6 Feb 2026.
17. MDCalc. Charlson Comorbidity Index (CCI). Available from: https://www.mdcalc.com/calc/3917/charlson-comorbidity-index-cci. Accessed 6 Feb 2026.
18. Evidencio. Modified Frailty Index. Available from: https://www.evidencio.com/models/show/1777. Accessed 6 Feb 2026.
19. Lee AW, Ng WT, Pan JJ, Poh SS, Ahn YC, AlHussain H, et al. International guideline for the delineation of the clinical target
volumes (CTV) for nasopharyngeal carcinoma. Radiother Oncol. 2018;126:25–36.
Crossref
20. Grégoire V, Ang K, Budach W, Grau C, Hamoir M, Langendijk JA, et al. Delineation of the neck node levels for head and neck tumors:
a 2013 update. DAHANCA, EORTC, HKNPCSG, NCIC CTG,
NCRI, RTOG, TROG consensus guidelines. Radiother Oncol.
2014;110:172-81.
Crossref
21.United States Department of Health and Human Services. Common
Terminology Criteria for Adverse Events (CTCAE) Version 5.0.
2017 Nov 27. Available from: https://dctd.cancer.gov/research/ctep-trials/for-sites/adverse-events/ctcae-v5-5x7.pdf. Accessed 6 Feb 2026.
22. Zeng Q, Xiang YQ, Wu PH, Lv X, Qian CN, Guo X. A matched
cohort study of standard chemo-radiotherapy versus radiotherapy
alone in elderly nasopharyngeal carcinoma patients. PLoS One.
2015;10:e0119593.
Crossref
23. Lu Y, Hua J, Yan F, Jiang C, Piao Y, Ye Z, et al. Combined
radiotherapy and chemotherapy versus radiotherapy alone in elderly
patients with nasopharyngeal carcinoma: a SEER population-based
study. Medicine (Baltimore). 2021;100:e26629.
Crossref
24. Lyu Y, Ni M, Zhai R, Kong F, Du C, Hu C, et al. Clinical
characteristics and prognosis of elderly nasopharyngeal carcinoma
patients receiving intensity-modulated radiotherapy. Eur Arch
Otorhinolaryngol. 2021;278:2549-57.
Crossref
25. Sommat K, Yit NL, Wang F, Lim JH. Impact of comorbidity
on tolerability and survival following curative intent intensity
modulated radiotherapy in older patients with nasopharyngeal
cancer. J Geriatr Oncol. 2018;9:352-8.
Crossref
26. Lee AW, Ng WT, Chan LL, Hung WM, Chan CC, Sze HC, et al.
Evolution of treatment for nasopharyngeal cancer—success and
setback in the intensity-modulated radiotherapy era. Radiother
Oncol. 2014;110:377-84.
Crossref
27. Fatima K, Andleeb A, Sofi MA, Rasool MT, Fir A, Nasreen S, et al.
Clinical outcome of intensity-modulated radiotherapy versus
two-dimensional conventional radiotherapy in locally advanced
nasopharyngeal carcinoma: comparative study at SKIMS Tertiary
Care Institute. J Cancer Res Ther. 2022;18:133-9.
Crossref
28. Peng G, Wang T, Yang KY, Zhang S, Zhang T, Li Q, et al.
A prospective, randomized study comparing outcomes and
toxicities of intensity-modulated radiotherapy vs. conventional
two-dimensional radiotherapy for the treatment of nasopharyngeal
carcinoma. Radiother Oncol. 2012;104:286-93.
Crossref
29. Morse RT, Ganju RG, Gan GN, Cao Y, Neupane P, Kakarala K,
et al. Sarcopenia and treatment toxicity in older adults undergoing
chemoradiation for head and neck cancer: identifying factors to
predict frailty. Cancers (Basel). 2022;14:2094.
Crossref
30. Lai SZ, Li WF, Chen L, Luo W, Chen YY, Liu LZ, et al. How
does intensity-modulated radiotherapy versus conventional
two-dimensional radiotherapy influence the treatment results in
nasopharyngeal carcinoma patients? Int J Radiat Oncol Biol Phys.
2011;80:661-8.
Crossref
31. Wildiers H, Heeren P, Puts M, Topinkova E, Janssen-Heijnen ML,
Extermann M, et al. International Society of Geriatric Oncology
consensus on geriatric assessment in older patients with cancer. J
Clin Oncol. 2014;32:2595-603.
Crossref
32. Mohile SG, Dale W, Somerfield MR, Hurria A. Practical assessment
and management of vulnerabilities in older patients receiving
chemotherapy: ASCO Guideline for Geriatric Oncology Summary.
J Oncol Pract. 2018;14:442-6.
Crossref
33. Guo R, Chen XZ, Chen L, Jiang F, Tang LL, Mao YP, et al.
Comorbidity predicts poor prognosis in nasopharyngeal carcinoma:
development and validation of a predictive score model. Radiother
Oncol. 2015;114:249-56.
Crossref
34. Wang X, Wang Y, Jiang S, Zhao J, Wang P, Zhang X, et al.
Safety and effectiveness of de-escalated radiation dose in T1-3
nasopharyngeal carcinoma: a propensity matched analysis. J
Cancer. 2019;10:5057-64.
Crossref
Improving Breast Cancer Detection in Screening Mammography with Artificial Intelligence Assistance: A Multi-reader Retrospective Study
ORIGINAL ARTICLE CME
Hong Kong J Radiol 2026 Mar;29(1):e15-22 | Epub 26 February 2026
Improving Breast Cancer Detection in Screening Mammography with Artificial Intelligence Assistance: A Multi-reader Retrospective Study
PL Lam1, D Fenn1, EH Chan2, EWS Fok3, PH Lee1, KM Kwok2, LKM Wong1, WS Mak1, WP Cheung1, WI Sit1, WK Ng1, GCY Chan1, LW Lo1, EPY Fung1
1 Department of Diagnostic and Interventional Radiology, Kwong Wah Hospital, Hong Kong SAR, China
2 Department of Diagnostic and Interventional Radiology, Princess Margaret Hospital, Hong Kong SAR, China
3 Department of Radiology and Organ Imaging, United Christian Hospital, Hong Kong SAR, China
Correspondence: Dr PL Lam, Department of Diagnostic and Interventional Radiology, Kwong Wah Hospital, Hong Kong SAR, China. Email: lpl404@ha.org.hk
Submitted: 29 August 2024; Accepted: 9 December 2024.
Contributors: DF, EWSF and EPYF designed the study. DF, EWSF, PHL, KMK, LKMW, WSM, WPC, WIS, WKN, GCYC, LWL and EPYF
acquired the data. PLL, DF, EHC, EWSF and EPYF analysed the data. PLL drafted the manuscript. All authors critically revised the manuscript
for important intellectual content. All authors had full access to the data, contributed to the study, approved the final version for publication, and
take responsibility for its accuracy and integrity.
Conflicts of Interest: All authors have disclosed no conflicts of interest.
Funding/Support: This research received no specific grant from any funding agency in the public, commercial, or not-for-profit sectors.
Data Availability: All data generated or analysed during the present study are available from the corresponding author on reasonable request.
Ethics Approval: This research was approved by the Central Institutional Review Board of Hospital Authority, Hong Kong (Ref No.: CIRB-2024-074-5). The requirement for informed consent from patients was waived by the Board due to the retrospective nature of the research.
Acknowledgement: The authors thank the Well Women Clinic of Tung Wah Group of Hospitals and radiologists from the Department of
Diagnostic and Interventional Radiology of Kwong Wah Hospital for their support of this study.
Supplementary Material: The supplementary material was provided by the authors and some information may not have been peer reviewed. Any
opinions or recommendations discussed are solely those of the author(s) and are not endorsed by the Hong Kong College of Radiologists. The
Hong Kong College of Radiologists disclaims all liability and responsibility arising from any reliance placed on the content.
Abstract
Introduction
This study aimed to compare the performance of radiologists in screening mammography for breast
cancer detection, with and without artificial intelligence (AI) assistance, including subgroup comparison between
breast radiologists and general radiologists in Hong Kong.
Methods
This was a single-centre multi-reader retrospective study. A screening mammography test set was used
(the Hong Kong Personal Performance in Mammographic Screening Scheme), comprising 80 mammograms with
negative or benign findings and 36 mammograms with pathologically proven breast cancer acquired from December
2009 to December 2023. Radiologists’ performance with and without AI assistance from a commercially available
tool (Lunit INSIGHT MMG) was evaluated from December 2023 to April 2024. The two reading sessions were
separated by a 4-week washout period. Study endpoints included sensitivity and specificity in the mammographic
detection of breast cancer. The Obuchowski–Rockette model was used to estimate and compare diagnostic accuracy.
Results
A total of 16 radiologists completed the test set, including nine (56.3%) breast radiologists and seven
(43.8%) general radiologists. Without AI assistance, the overall sensitivity and specificity in breast cancer detection
were 73.3% and 89.9%, respectively. With AI assistance, both metrics improved significantly to 80.7% (p = 0.007)
and 94.3% (p < 0.001), respectively. Subgroup analysis showed that breast radiologists demonstrated improved
specificity from 87.6% to 92.6% (p < 0.001), while general radiologists acquired more sensitivity from 54.0% to
66.7% (p < 0.001) with the use of AI.
Conclusion
AI assistance significantly improved the diagnostic accuracy of breast radiologists and general
radiologists in screening mammography for breast cancer detection.
Key Words: Artificial intelligence; Breast neoplasms; Mammography; Mass screening
中文摘要
利用人工智能輔助乳房X光檢查提高乳癌篩檢檢出率:一項多位閱片者回顧性研究
林栢麟、范德信、陳恩灝、霍泳珊、李璧希、郭勁明、黃嘉敏、麥詠詩、張偉彬、薛詠妍、吳詠淇、陳頌恩、羅麗雲、馮寶恩
引言
本研究旨在比較香港放射科醫生在乳房X光檢查篩檢乳癌時應用和不應用人工智能輔助兩種情況下的表現,並對乳腺放射科醫生和一般放射科醫生進行亞組比較。
方法
本研究為單中心多位閱片者回顧性研究。研究採用篩檢乳房X 光攝影測試集(HKPERFORMS),此測試集包含於2009年12月至2023年12月期間採集的80例陰性或良性乳房X光攝影影像及36例經病理證實為乳癌的乳房X光攝影影像。研究於2023年12月至2024年4月期間評估了放射科醫生在應用和不應用商用人工智能輔助工具(Lunit INSIGHT MMG)兩種情況下的表現。兩次閱片之間相隔4週洗脫期。研究終點包括乳房X光攝影檢測乳癌的敏感性和特異性。我們採用Obuchowski-Rockette模型評估及比較診斷準確性。
結果
共有16位放射科醫生完成了測試集,其中9名(56.3%)為乳腺放射科醫生,7名(43.8%)為一般放射科醫生。在未使用人工智能輔助的情況下,乳癌檢測的整體敏感性和特異性分別為73.3%和89.9%。使用人工智能輔助後,這兩項指標均顯著提高,分別達到80.7%(p = 0.007)和94.3%(p < 0.001)。亞組分析顯示,使用人工智能後,乳腺放射科醫生的特異性從87.6%提高到92.6%(p < 0.001),而一般放射科醫生的敏感性則從54.0%提高到66.7%(p < 0.001)。
結論
人工能輔助顯著提高了乳腺放射科醫生和一般放射科醫生在乳癌篩檢中應用乳房X光攝影的診斷準確率。
INTRODUCTION
In Hong Kong, breast cancer has been the most common
malignancy among the female population since the early
1990s, with increasing incidence every year. It accounted
for over a quarter (28.9%) of new cancer cases in 2023.[1]
It was also the third leading cause of cancer deaths in
women.[1] Fortunately, breast cancer can be curable in its
early stages, with over 95% 5-year survival for patients
with stage I disease.[2] Previous randomised controlled
trials and meta-analyses have demonstrated the efficacy
of screening mammography in detecting early-stage
tumours and reducing breast cancer–related deaths.[3] [4] [5] [6]
Breast screening programmes have been established in
multiple developed economies worldwide. In Western
countries, the American Cancer Society recommends
that women consider annual mammography screening
starting at the age of 40 years,[7] whereas in the United
Kingdom, the National Health Service offers breast
screening every 3 years for women aged between 50
and 71 years.[8] In Asian countries, such as Japan,[9] South Korea[10] and Singapore,[11] breast screening programmes
have been in place for over a decade. In Hong Kong, the
Centre for Health Protection recommends that women in
the general population aged 44 to 69 years with an average
risk of breast cancer consider mammography screening
every 2 years.[12] Together with increased advocacy from
non-profit organisations, which have heightened disease
awareness among the public, screening mammography
has become more popular.[13]
Like most tests, the diagnostic accuracy of screening
mammography is not absolute. Sensitivity and specificity
in breast cancer detection range between approximately
50% to 80% and about 80% to 90%, respectively, in the
literature.[14] [15] [16] [17] False-positive results lead to additional
workup and the associated anxiety in patients, while
false-negative results can delay treatment and worsen
prognosis.[14]
Recent advancements in machine learning have led to
the increased use of artificial intelligence (AI) in clinical radiology. Some studies, mainly conducted in Western
countries, have shown promising results in employing
AI-based tools to improve the diagnostic accuracy of
screening mammography.[18] [19] [20] [21]
AI-supported software has become more accessible
and commercially available. To the best of our
knowledge, there are no published studies evaluating
the diagnostic performance of screening mammography
with AI assistance in Hong Kong. The lack of
established evidence in our local population could
be a hurdle for radiologists to consider AI-assisted
screening mammography. The external validity of
previous research poses a major concern. Screening
mammography tests employed in studies performed
in Western countries were mainly selected from
Caucasian patients.[22] Asian women, on the other hand,
generally have different breast composition, with a
higher prevalence of dense breasts. This can obscure
abnormalities on mammograms, limiting the detection
of breast cancer and reducing diagnostic accuracy.[23] [24] [25]
Investigations on how AI-based tools could facilitate
screening mammography using test sets derived from a
local Asian population could bridge this data gap.
This study aimed to compare the performance of
radiologists in screening mammography to detect
breast cancer with and without AI assistance in the
local population. Subgroup comparisons between
breast radiologists and general radiologists were also
performed.
METHODS
We developed a test set, the Hong Kong Personal
Performance in Mammographic Screening Scheme
(HKPERFORMS), to evaluate the diagnostic accuracy of
radiologists in detecting breast cancer in the local Asian
population with and without AI assistance. The test set
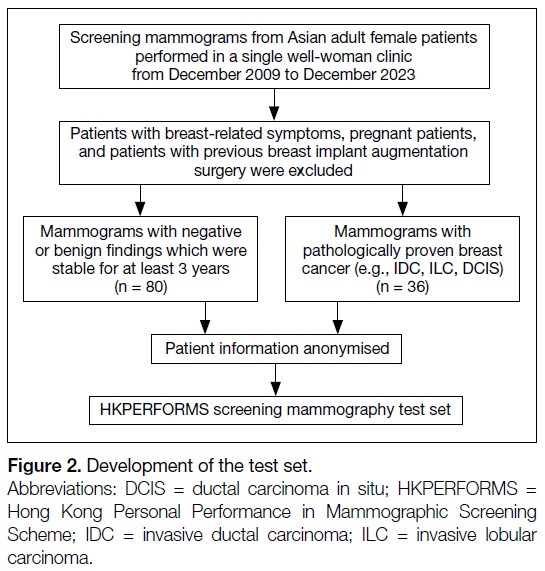
comprised mammograms retrospectively selected from
Asian adult female patients aged 40 years or above who
underwent breast screening in a single well-woman clinic
from December 2009 to December 2023. Exclusion
criteria included symptomatic patients (e.g., those with a
palpable breast mass), pregnant patients, and those with
a history of breast implant augmentation surgery.
All studies in HKPERFORMS were two-dimensional
(2D) screening full-field digital mammograms with
standard craniocaudal and mediolateral oblique views.
There were 80 mammograms showing negative or
benign findings, confirmed as stable on subsequent mammographic follow-up for at least 3 years as
assessed by breast radiologists recognised by the Hong
Kong College of Radiologists (HKCR). There were
36 mammograms with pathologically proven breast
cancer, including invasive ductal carcinoma, invasive
lobular carcinoma, and ductal carcinoma in situ. Their
mammographic appearances included mass (n = 21,
58.3%), calcifications (n = 6, 16.7%), architectural
distortion (n = 5, 13.9%), and asymmetry (n = 4, 11.1%).
The mammograms in the test set (n = 116) included
breasts of varying densities: extremely dense (13.8%),
heterogeneously dense (72.4%), scattered areas of
fibroglandular density (12.1%), and almost entirely fatty
(1.7%) [Figure 1]. Patient information and identifiers,
such as name and age, were anonymised before compiled
into the HKPERFORMS test set (Figure 2).
Figure 1. Proportion of breast densities in mammograms of the test set (n = 116).
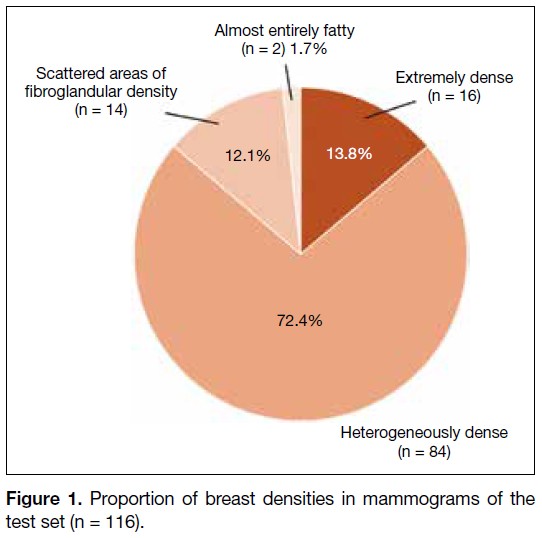
Figure 2. Development of the test set (n = 116).
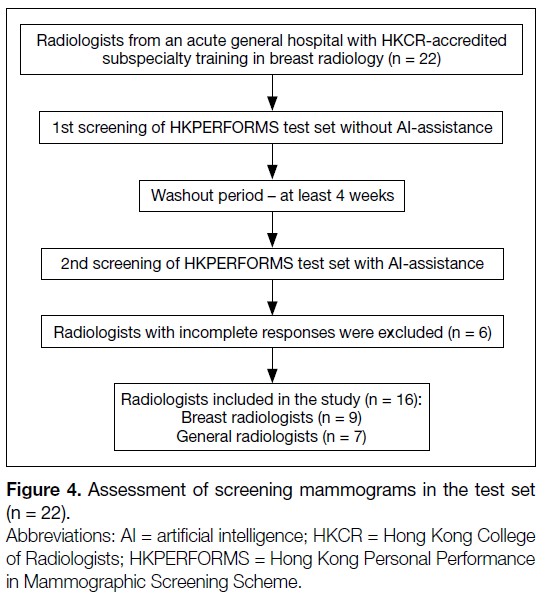
Reader Assessment
This was a single-centre study. Radiologists were
recruited from an acute general hospital with
subspecialty training in breast radiology accredited
by the HKCR. They included breast radiologists and
general radiologists. Breast radiologists were defined
as radiologists with at least 3 months of subspecialty
training recognised by the HKCR, or post-fellowship
breast radiology training, and at least 500 screening
mammograms read in the past year. General radiologists
were defined as HKCR members or fellows actively
practising in clinical radiology, but without dedicated
subspecialty training in breast radiology.
The recruited radiologists were blinded to all patient
information and identifiers in the HKPERFORMS
screening mammography test set. They assessed the
mammograms under standardised conditions using
dedicated software (Selenia Dimensions version 1.11;
Hologic, Bedford [MA], US) with diagnostic-quality
monitors (Coronis Uniti MDMC 12133; Barco, Kortrijk,
Belgium) in accordance with department standards.
Readers documented their screening results digitally
(SurveyMonkey; SurveyMonkey, San Mateo [CA], US).
Data to be entered included breast density, laterality,
quadrant, depth, and presence or absence of architectural
distortion if an abnormality was identified. Respondents
were required to classify each study as benign or
suspicious for malignancy.
All radiologists assessed the HKPERFORMS
test set twice. In the first reading, they read the
screening mammograms without AI assistance. In the
second reading, additional data were provided by a
commercially available AI-based tool (INSIGHT MMG
version 1.1.7.3; Lunit, Seoul, South Korea),[26] which
automatically highlighted regions perceived as abnormal
with a colour-coded heatmap indicating the degree of
suspicion. A predicted probability of malignancy was
also presented numerically (Figure 3). Both pre– and
post–AI-processed mammograms were available during
the second reading. Respondents were instructed to
record their screening results after reviewing all images. They were at liberty to follow or disregard the AI-based
assessment entirely. A washout period of at least 4 weeks
was observed between the two readings. The orders of
the screening mammograms in the test set were different
and randomised across the two sittings. Respondents
who did not complete either reading were excluded from
the study (Figure 4).
Figure 3. Screening mammogram of an adult female patient in (a)
craniocaudal and (b) mediolateral oblique views with application
of the artificial intelligence (AI)–based tool. A right breast upper
outer quadrant mass has been colour-coded red, while central
inner architectural distortion has been colour-coded green,
indicating AI-perceived abnormal regions with different degrees of
suspicion. Predicted probabilities of malignancy are also provided
numerically. Subsequent biopsies of both lesions confirmed
invasive ductal carcinoma of the right breast. The numbers on the
images represent predicted probabilities of malignancy.
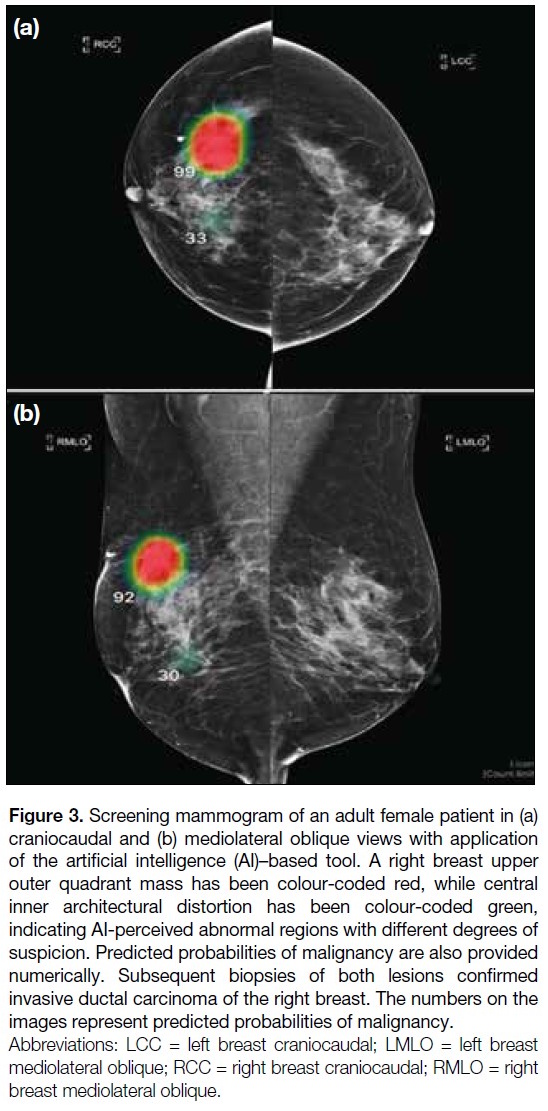
Figure 4. Assessment of screening mammograms in the test set (n = 22).
Background information of the recruited radiologists,
including prior subspecialty training in breast radiology
and experience in reporting breast imaging, was
collected. All responses submitted electronically were anonymised and a random computer-generated number
was assigned to each radiologist. Researchers were
blinded to the identity of the respondents.
Statistical Analysis
Statistical analysis was performed using R (macOS
version 4.4.1; R Core Team, Vienna, Austria).[27] Study
endpoints of diagnostic accuracy included sensitivity
and specificity in the mammographic detection of breast
cancer. The Obuchowski–Rockette model was used to
estimate and compare diagnostic accuracy.[28] A p value
of < 0.05 was considered statistically significant.
This manuscript was prepared in accordance with the
STROBE (Strengthening the Reporting of Observational
Studies in Epidemiology) guidelines.
RESULTS
Overall Performance
A total of 22 radiologists were invited to participate
in this study; six respondents who did not complete
the HKPERFORMS screening mammography test set
were excluded, resulting in 16 radiologists completing
the test set (Figure 4). Without AI assistance, the
mean sensitivity and specificity for detecting breast
cancer were 73.3% and 89.9%, respectively. With
AI assistance, there was significant improvement
in diagnostic accuracy, with the mean sensitivity
and specificity increasing to 80.7% (p = 0.007) and 94.3% (p < 0.001), respectively (Figure 5 and online supplementary Table).
Figure 5. Dot plots and 95% confidence intervals showing (a)
sensitivity and (b) specificity of all radiologists, breast radiologists,
and general radiologists in screening mammography for breast
cancer detection without (red circles) and with (blue squares)
artificial intelligence assistance.
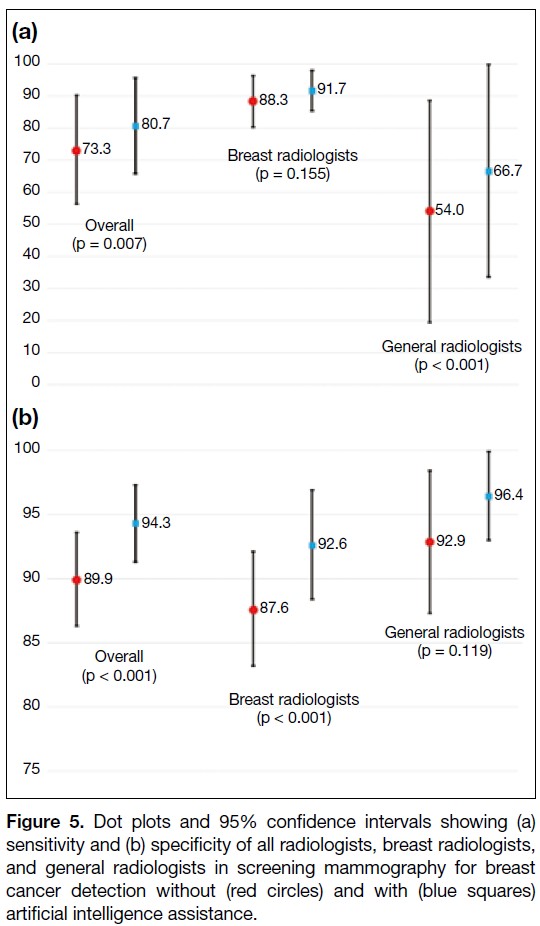
Subgroup Analysis
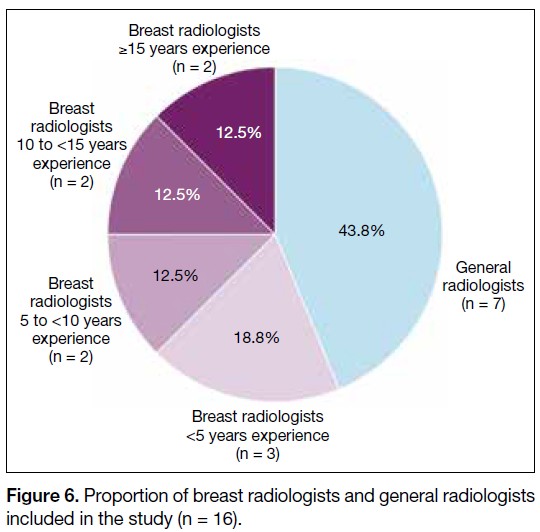
Among the respondents, nine (56.3%) were breast
radiologists and seven (43.8%) were general radiologists.
The experience of the breast radiologists is shown in
Figure 6. Without AI assistance, the mean sensitivity
of the breast radiologists (88.3%) was significantly
higher than that of the general radiologists (54.0%) in
identifying breast cancer (p = 0.017). There was no
significant difference in the mean specificity between
the two groups (breast radiologists: 87.6% vs. general
radiologists: 92.9%; p = 0.051). Using the AI-based tool,
there was significant improvement in the specificity of
the breast radiologists (from 87.6% to 92.6%; p < 0.001)
and the sensitivity of the general radiologists (from
54.0% to 66.7%; p < 0.001). No significant changes in the sensitivity of breast radiologists and the specificity
of general radiologists were observed after using the AI-based
tool (Figure 5 and online supplementary Table).
Figure 6. Proportion of breast radiologists and general radiologists
included in the study (n = 16).
DISCUSSION
Diagnostic Accuracy Without Artificial
Intelligence Assistance
Without assistance from the AI-based tool, the diagnostic
accuracy of the breast radiologists included in this study
was comparable to figures reported in the literature, with
both sensitivity and specificity exceeding 85%.[15] [16] [17] In
contrast, general radiologists were less likely to detect
breast malignancy, with a sensitivity of about 54%.
Screening tests with low sensitivity lead to a higher
proportion of false-negative results, potentially leading
to false reassurance and missed opportunities for early
diagnosis and treatment.[14] These findings highlight the
importance of dedicated training in breast radiology.[29] [30]
The HKCR Mammography Statement outlines the
standards for radiologists involved in screening. These
include a minimum of 3 months of subspecialty training
in breast radiology, interpretation of at least 500 screening
mammograms annually, and ongoing participation in
continuing medical education and multidisciplinary
meetings.[31]
Improved Performance with Artificial
Intelligence Assistance
There were significant improvements in overall
sensitivity and specificity in breast cancer detection
when radiologists in this study performed AI-assisted screening mammography. This echoed previous studies
which demonstrated improved diagnostic accuracy in AI-assisted
mammography readings.[18] [19] [20] [21] Subgroup analysis
further showed that the benefits of AI assistance differed
between general radiologists and breast radiologists.
For general radiologists, there was significant
improvement in sensitivity, from approximately 50%
when screening unaided to over 65% with the use of AI-based
tool. A previous study also demonstrated reduced
variability in screening results and increased inter-reader
reliability with AI assistance.[32] This indicates
that utilising AI could yield more expertise-independent
results. AI could act as an extra pair of eyes. Radiologists
could refer to colour-coded heatmaps generated by AI-based
software after initial mammography assessment to
reduce the probability of missing breast cancer.[26]
Among the breast radiologists, there was improvement
in specificity, while sensitivity in detecting breast cancer
remained similar with and without AI assistance. The
crux of screening lies in striking a balance between
sensitivity and specificity. Tests with high sensitivity but
low specificity may lead to over-investigation, resulting
in unnecessary stress and interventions for patients.[14]
While the specificity of the breast radiologists in breast
cancer detection was satisfactory without AI assistance,
it improved from over 85% to over 90% with the use
of the AI-based tool without compromising sensitivity.
Increased specificity in screening mammography would
reduce call-back rates, avoid unwarranted workups for
patients, and decrease the workload for radiologists.[20] [33]
A study by Raya-Povedano et al[34] revealed a reduction
of over 70% in radiologists’ workload following the
implementation of AI-based strategies. Additionally,
AI tools could be helpful to prioritise screening
mammograms with suspected malignancy. Such
abnormal studies could be flagged for earlier reporting
by radiologists, expediting subsequent workup and
treatment. Furthermore, placing flagged studies at the
beginning of a screening session could minimise the
risk of missed breast cancers due to reader fatigue. With
the burgeoning demand for screening mammography in
Hong Kong, AI-based tools could potentially alleviate
the stress faced by radiologists.
Limitations
The HKPERFORMS test set was enriched with
abnormal mammograms, and the proportion of cases
with biopsy-proven breast cancer was not representative
of routine screening practice or the general population.[1] [2] Although respondents were instructed to interpret each
individual mammogram as an independent screening
case, their diagnostic accuracy might have been
negatively influenced by the study design. Second,
test sets used in the sittings with and without AI
assistance were identical. Despite a washout period
of at least 4 weeks with randomisation of the image
order, radiologists might have recalled the proportion
of normal to abnormal cases, potentially introducing
bias in the second sitting. Third, all mammograms in
the test set were 2D full-field digital mammograms. In
recent years, three-dimensional mammography or digital
breast tomosynthesis (DBT) has become more popular,
with evidence showing improved diagnostic accuracy
compared with traditional 2D mammography. Studies on
AI-assisted DBT have shown non-inferior or improved
sensitivity and specificity in detecting breast cancer.[35] [36]
Our study did not investigate DBT performance, which
remains a potential direction for further research. Finally,
this was a single-centre study with limited sample size.
The performance and influence of AI may vary among
radiologists with differing levels of experience across
diverse clinical settings. Further large-scale multi-centre
investigations would provide a more comprehensive
assessment.
CONCLUSION
This multi-reader study evaluated the potential of AI to
aid breast cancer detection using HKPERFORMS, an
original screening mammography test set developed from
a local Asian female population with a high incidence of
dense breasts. The results demonstrated that diagnostic
accuracy in screening mammography was improved
across radiologists with varying levels of experience in
breast radiology when supported by AI-based tools.
REFERENCES
1. Centre for Health Protection, Department of Health, Hong Kong SAR Government. Breast Cancer. 23 Jan 2026. Available from: https://www.chp.gov.hk/en/healthtopics/content/25/53.html. Accessed 2 Feb 2026.
2. Kwong A, Mang OW, Wong CH, Chau WW, Law SC; Hong Kong Breast Cancer Research Group. Breast cancer in Hong Kong, Southern China: the first population-based analysis of epidemiological characteristics, stage-specific, cancer-specific, and disease-free survival in breast cancer patients: 1997–2001. Ann Surg Oncol. 2011;18:3072–8.
Crossref
3. Moss SM, Cuckle H, Evans A, Johns L, Waller M, Bobrow L, et al. Effect of mammographic screening from age 40 years on breast cancer mortality at 10 years’ follow-up: a randomised controlled trial. Lancet. 2006;368:2053–60.
Crossref
4. Duffy SW, Tabár L, Chen HH, Holmqvist M, Yen MF, Abdsalah S, et al. The impact of organized mammography service screening on breast carcinoma mortality in seven Swedish counties. Cancer. 2002;95:458–69.
Crossref
5. Tabár L, Vitak B, Chen HH, Yen MF, Duffy SW, Smith RA. Beyond randomized controlled trials: organized mammographic screening substantially reduces breast carcinoma mortality. Cancer. 2001;91:1724–31.
Crossref
6. Kerlikowske K, Grady D, Rubin SM, Sandrock C, Ernster VL. Efficacy of screening mammography. A meta-analysis. JAMA. 1995;273:149–54.
Crossref
7. American Cancer Society. American Cancer Society recommendations for the early detection of breast cancer. Available from: https://www.cancer.org/cancer/types/breast-cancer/screening-tests-and-early-detection/american-cancer-society-recommendations-for-the-early-detection-of-breast-cancer.html. Accessed 20 Aug 2024.
8. National Health Service, Department of Health and Social Care, United Kingdom Government. Breast screening (mammogram). Available from: https://www.nhs.uk/conditions/breast-screening-mammogram/. Accessed 20 Aug 2024.
9. Hamashima CC, Hattori M, Honjo S, Kasahara Y, Katayama T, Nakai M, et al. The Japanese guidelines for breast cancer screening. Jpn J Clin Oncol. 2016;46:482–92.
Crossref
10. Shin DW, Yu J, Cho J, Lee SK, Jung JH, Han K, et al. Breast cancer screening disparities between women with and without disabilities: a national database study in South Korea. Cancer. 2020;126:1522–9.
Crossref
11. Loy EY, Molinar D, Chow KY, Fock C. National Breast Cancer Screening Programme, Singapore: evaluation of participation and performance indicators. J Med Screen. 2015;22:194–200.
Crossref
12. Cancer Expert Working Group on Cancer Prevention and Screening, Centre for Health Protection, Department of Health, Hong Kong SAR Government. Recommendations on Prevention and Screening for Breast Cancer for Health Professionals. June 2020. Available from: https://www.chp.gov.hk/files/pdf/breast_cancer_professional_hp.pdf. Accessed 20 Aug 2024.
13. Hong Kong Breast Cancer Foundation. What is breast cancer. Available from: https://www.hkbcf.org/en/breast_cancer/main/422/. Accessed 20 Aug 2024.
Crossref
14. Marmot MG, Altman DG, Cameron DA, Dewar JA, Thompson SG, Wilcox M. The benefits and harms of breast cancer screening: an independent review. Br J Cancer. 2013;108:2205–40.
Crossref
15. Hollingsworth AB. Redefining the sensitivity of screening mammography: a review. Am J Surg. 2019;218:411–8.
Crossref
16. Kerlikowske K, Grady D, Barclay J, Sickles EA, Ernster V. Likelihood ratios for modern screening mammography. Risk of breast cancer based on age and mammographic interpretation. JAMA. 1996;276:39–43.
Crossref
17. Lehman CD, Wellman RD, Buist DS, Kerlikowske K, Tosteson AN, Miglioretti DL, et al. Diagnostic accuracy of digital screening mammography with and without computer-aided detection. JAMA Intern Med. 2015;175:1828–37.
Crossref
18. Dembrower K, Crippa A, Colón E, Eklund M, Strand F; ScreenTrustCAD Trial Consortium. Artificial intelligence for breast cancer detection in screening mammography in Sweden: a prospective, population-based, paired-reader, non-inferiority study. Lancet Digit Health. 2023;5:e703–11.
Crossref
19. Lång K, Josefsson V, Larsson AM, Larsson S, Högberg C, Sartor H,
et al. Artificial intelligence–supported screen reading versus
standard double reading in the Mammography Screening with
Artificial Intelligence trial (MASAI): a clinical safety analysis of
a randomised, controlled, non-inferiority, single-blinded, screening
accuracy study. Lancet Oncol. 2023;24:936-44. Crossref
20. Lauritzen AD, Lillholm M, Lynge E, Nielsen M, Karssemeijer N,
Vejborg I. Early indicators of the impact of using AI in mammography
screening for breast cancer. Radiology. 2024;311:e232479.
Crossref
21. Ng AY, Oberije CJ, Ambrózay E, Szabó E, Serfozó O, Karpati E, et al. Prospective implementation of AI-assisted screen reading to improve early detection of breast cancer. Nat Med. 2023;29:3044–9.
Crossref
22. Chen Y, Gale A. Performance assessment using standardized
data sets: the PERFORMS scheme in breast screening and other
domains. In: Samei E, Krupinski EA, editors. The Handbook of
Medical Image Perception and Techniques. 2nd ed. Cambridge,
England: Cambridge University Press; 2018: 328-42. Crossref
23. Bao C, Shen J, Zhang Y, Zhang Y, Wei W, Wang Z, et al.
Evaluation of an artificial intelligence support system for breast
cancer screening in Chinese people based on mammogram. Cancer
Med. 2023;12:3718-26.
Crossref
24. Yan H, Ren W, Jia M, Xue P, Li Z, Zhang S, et al. Breast cancer
risk factors and mammographic density among 12518 average-risk
women in rural China. BMC Cancer. 2023;23:952.
Crossref
25. Jackson VP, Hendrick RE, Feig SA, Kopans DB. Imaging of the
radiographically dense breast. Radiology. 1993;188:297-301.
Crossref
26. Kim HE, Kim HH, Han BK, Kim KH, Han K, Nam H, et al. Changes
in cancer detection and false-positive recall in mammography using
artificial intelligence: a retrospective, multireader study. Lancet
Digit Health. 2020;2:e138-48. Crossref
27. R Core Team. R: a language and environment for statistical
computing. Vienna: R Foundation for Statistical Computing; 2020.
28. Hillis SL, Obuchowski NA, Berbaum KS. Power estimation for
multireader ROC methods: an updated and unified approach. Acad
Radiol. 2011;18:129-42. Crossref
29. Trieu PD, Lewis SJ, Li T, Ho K, Wong DJ, Tran OT, et al.
Improving radiologist’s ability in identifying particular abnormal
lesions on mammograms through training test set with immediate feedback. Sci Rep. 2021;11:9899. Crossref
30. Miglioretti DL, Gard CC, Carney PA, Onega TL, Buist DS,
Sickles EA, et al. When radiologists perform best: the learning
curve in screening mammogram interpretation. Radiology.
2009;253:632-40. Crossref
Hong Kong College of Radiologists. Hong Kong College of
Radiologists Mammography Statement. Revised 25 August 2015.
Available from: https://www.hkcr.org/templates/OS03C00336/case/lop/HKCR%20Mammography%20Statement_rev20150825.
pdf. Accessed 20 Aug 2024.
32. Pacilè S, Lopez J, Chone P, Bertinotti T, Grouin JM, Fillard P.
Improving breast cancer detection accuracy of mammography with
the concurrent use of an artificial intelligence tool. Radiol Artif
Intell. 2020;2:e190208. Crossref
33. Kim YS, Jang MJ, Lee SH, Kim SY, Ha SM, Kwon BR, et al.
Use of artificial intelligence for reducing unnecessary recalls at
screening mammography: a simulation study. Korean J Radiol.
2022;23:1241-50. Crossref
34. Raya-Povedano JL, Romero-Martín S, Elías-Cabot E, Gubern-
Mérida A, Rodríguez-Ruiz A, Álvarez-Benito M. AI-based
strategies to reduce workload in breast cancer screening with
mammography and tomosynthesis: a retrospective evaluation.
Radiology. 2021;300:57-65. Crossref
35. Goldberg JE, Reig B, Lewin AA, Gao Y, Heacock L, Heller SL,
et al. New horizons: artificial intelligence for digital breast
tomosynthesis. Radiographics. 2022;43:e220060. Crossref
36. Park EK, Kwak S, Lee W, Choi JS, Kooi T, Kim EK. Impact of
AI for digital breast tomosynthesis on breast cancer detection and
interpretation time. Radiol Artif Intell. 2024;6:e230318.
Crossref
Perilesional Sclerosis Associated with Dreaded Black Lines in Incomplete Atypical Femoral Fractures after Antiresorptive Therapy
ORIGINAL ARTICLE
Hong Kong J Radiol 2026 Mar;29(1):e23-9 | Epub 27 February 2026
Perilesional Sclerosis Associated with Dreaded Black Lines in
Incomplete Atypical Femoral Fractures after Antiresorptive Therapy
KC Wong1, GJW Cheok1, SB Koh1, P Chandra Mohan2, MA Png2, TS Howe1 YH Ng1
1 Department of Orthopaedic Surgery, Singapore General Hospital, Singapore
2 Department of Diagnostic Radiology, Singapore General Hospital, Singapore
Correspondence: Dr KC Wong, Department of Orthopaedic Surgery, Singapore General Hospital, Singapore. Email: khaicheong.wong@mohh.com.sg
Submitted: 12 June 2024; Accepted: 8 September 2025.
Contributors: SBK and TSH designed the study. KCW and GJWC acquired and analysed the data. All authors drafted the manuscript and
critically revised the manuscript for important intellectual content. All authors had full access to the data, contributed to the study, approved the
final version for publication, and take responsibility for its accuracy and integrity.
Conflicts of Interest: All authors have disclosed no conflicts of interest.
Funding/Support: This research received no specific grant from any funding agency in the public, commercial, or not-for-profit sectors.
Data Availability: All data generated or analysed during the present study are available from the corresponding author on reasonable request.
Ethics Approval: This research was approved by the SingHealth Centralised Institutional Review Board, Singapore (Ref No.: 2019/2668). The requirement
for informed patient consent was waived by the Board as non-identifiable data were used and due to the retrospective nature of the research.
Abstract
Introduction
This study aimed to describe the demographic, clinical, and radiological features of sclerosis adjacent
to ‘dreaded black lines’ or radiolucent fracture lines (RFLs) in atypical femoral fractures (AFFs) associated with
antiresorptive therapy.
Methods
We reviewed radiographs acquired in our institution in Singapore between 2004 and 2020 from 100 femurs
with AFFs, assessing the appearance and location of lesions, and the presence of endosteal or periosteal thickening.
Demographic data, type and duration of antiresorptive therapy, and progression to complete fracture or need for
prophylactic stabilisation were analysed. The cohort was subdivided into three groups: Group 1A included AFFs
with an RFL and perilesional sclerosis; Group 1B included AFFs with an RFL but without perilesional sclerosis;
and Group 2 included AFFs without an RFL.
Results
A total of 17 sclerotic RFLs were identified. The majority were non-linear in appearance. Most were located
in the subtrochanteric (41.2%) and proximal diaphyseal regions (35.3%), and all were associated with endosteal
or periosteal thickening. All sclerotic RFLs occurred in patients with a mean age of 69 years. Sixteen cases (94.1%)
had a history of bisphosphonate use, while one case had received denosumab. The mean duration of antiresorptive
therapy was 66 months. Three cases (17.6%) progressed to complete fractures and six (35.3%) required prophylactic
fixation. No significant differences were observed among the three groups in terms of demographics, antiresorptive
therapy, or surgical intervention.
Conclusion
We describe perilesional sclerosis as a previously unrecognised radiological feature adjacent to RFLs
in AFFs, with distinctive characteristics. It occurs in approximately one-third of RFLs. Further research is needed
to elucidate its pathophysiological and prognostic implications.
Key Words: Biphosphonates; Femoral fractures; Sclerosis
中文摘要
抗骨質吸收治療後不完全性非典型股骨骨折伴隨怪樣黑線周圍硬化
黃啟翔、石佳偉、許鑽美、P Chandra Mohan、方明愛、侯德生、黃勇輝
引言
本研究旨在描述接受抗骨質吸收治療的非典型股骨骨折(atypical femoral fractures, AFF)中,鄰近「怪樣黑線」或透光骨折線(radiolucent fracture lines, RFL)的骨質硬化之人口統計學、臨床及放射學特徵。
方法
我們對2004至2020年間在新加坡我院就診的100例AFF患者之X光片進行回顧性分析,評估病變的形態與位置,以及是否存在骨內膜或骨外膜增厚,同時分析患者的人口統計學資料、抗骨質吸收治療的類型與持續時間,以及是否進展為完全性骨折或需要預防性固定。我們根據影像表現將患者分為三組:1A組為伴有RFL及病灶周圍硬化的AFF;1B組為伴有RFL但無病灶周圍硬化的AFF;2組為無RFL的AFF。
結果
共發現17例硬化性RFL,多呈非線性形態。大多位於股骨大轉子下區(41.2%)及近端骨幹區(35.3%),所有病例均伴隨骨內膜或骨外膜增厚。硬化性RFL患者的平均年齡為69歲,其中16例(94.1%)有雙磷酸鹽使用史,1例曾接受地舒單抗治療。抗骨質吸收治療的平均持續時間為66個月。3例(17.6%)進展為完全性骨折,6例(35.3%)需接受預防性內固定。三組患者在人口統計學特徵、抗骨質吸收治療或手術介入方面均無顯著差異。
結論
我們描述了病灶周圍硬化,此為一種先前未被識別的AFF中RFL附近之放射學特徵,具有獨特的表現形式。其發生率約佔RFL病例的三分之一。需進一步研究以闡明其病理生理機制及預後意義。
INTRODUCTION
Atypical femoral fractures (AFFs) were first recognised
as a distinct clinical entity following multiple clinical
reports, yet their pathophysiology and clinical
characteristics remain incompletely understood.[1] [2]
Over time, our understanding of AFFs has evolved,
as reflected in ongoing efforts by a task force of the
American Society for Bone and Mineral Research
(ASBMR) to refine diagnostic criteria.[1] [2] Major features
used to define AFFs were first established in 2010 and
included fractures following low-energy or no trauma,
transverse fractures originating from the lateral cortex
which may become oblique medially, complete fractures
with a medial spike, and incomplete fractures involving
only the lateral cortex, with minimal or no comminution
and localised periosteal or endosteal thickening of the
lateral cortex.[1] Minor features associated but not required
for diagnosis include generalised femoral diaphyseal
cortical thickening, unilateral or bilateral prodromal pain
in the groin or thigh, incomplete or complete fractures of
both femoral diaphyses, and delayed fracture healing.[1]
In 2014, new epidemiological studies and clinical data
prompted the ASBMR to revise the definition of AFFs, emphasising their diaphyseal location and requiring at
least four of the five major features for diagnosis.[2] This
refined definition provides a more precise framework for
identifying AFFs and distinguishing them from typical
osteoporotic femoral fractures.2 This reflects the dynamic
and evolving nature of our understanding of AFFs and
highlights that much remains unknown, including the
identification of potential novel clinical and radiological
features and their implications for patient management.
Radiological studies have also expanded our
understanding of AFFs, particularly when Mohan et al[3]
described multifocal endosteal thickening along the
femoral diaphysis in bisphosphonate-related AFFs,
highlighting its association with a periosteal beak and/or
a ‘dreaded black line’, also referred to as a radiolucent
fracture line (RFL). These features were associated
with an increased risk of progression to fracture.[3] A
subsequent study by Png et al[4] demonstrated that when
an RFL is present, the lesion is likely to persist, either
remaining static or progressing to a displaced fracture.
The significance of RFLs was also emphasised in the
2015 position statement by the Korean Society for Bone and Mineral Research, which recommended prophylactic
femoral nailing in the presence of an RFL, especially
when located in the subtrochanteric region.[5]
Despite these insights, gaps remain in the literature, as
not all RFLs progress to complete fractures and there are
no clear discerning features to guide when prophylactic
fixation is indicated. During our review of patients
with AFFs, we observed a previously undescribed
radiological feature: perilesional sclerosis—an area
of sclerosis closely associated with the presence of an
RFL seen in an incomplete AFF. This finding, distinct
from previously reported radiological features of AFFs,
may have implications for understanding bone stability,
fracture progression, and management strategies, as
sclerosis has previously been suggested to be associated
with fatigue fractures and delayed fracture healing.[6]
Although with established diagnostic criteria and the
recognition of RFLs as high-risk markers, it remains
unclear why not all RFLs progress to complete fractures
or ultimately require intervention. To date, no study has
described the presence or significance of perilesional
sclerosis in relation to RFLs in AFFs. Our study aimed
to address this gap by identifying and characterising
this radiological feature in association with RFLs in
incomplete AFFs, and by exploring its potential clinical
implications.
METHODS
Study Cohort
We retrospectively reviewed plain radiographs of
cases of incomplete AFFs in patients presenting to our
institution, Singapore General Hospital in Singapore, while receiving bisphosphonate
therapy between 2004 and 2020. These cases were
retrieved from our institutional AFF registry, which
includes patients exhibiting features of AFF that have
not yet progressed to a complete fracture.
We reviewed all available plain radiographs of the
AFFs, as well as those of the contralateral femur when
available. Perilesional sclerosis was defined as a linear
area of sclerosis observed on either side of an RFL. All
anteroposterior and lateral views were obtained using
standard radiographic techniques, and all analysed
fractures met the ASBMR criteria for an AFF.[3] [4]
The study cohort of 100 AFFs was subsequently divided
into three groups: Group 1A included AFFs with an RFL
and perilesional sclerosis; Group 1B included AFFs with
an RFL but without perilesional sclerosis; and Group 2 included AFFs without an RFL.
We also analysed age data and collected information on
the type and duration of bisphosphonate therapy. Patients
were followed up for sequelae, including progression to
complete fracture or subsequent prophylactic fixation.
Prophylactic fixation was performed in cases of
persistent pain at the site of AFFs, while surgical fixation
was performed for patients who progressed to complete
fractures.
Image Analysis
All radiographs were reviewed for the presence of RFLs
with adjacent sclerosis using Vue Motion (Carestream
Health, Rochester [NY], US), and independently assessed
by two authors (SBK and TSH), each with over 20 years of
clinical orthopaedic experience. RFLs were categorised
into one of four patterns: (1) RFL without sclerosis
(Figure 1); (2) RFL with linear sclerosis (Figure 2);
(3) RFL with patchy continuous sclerosis (Figure 3); and
(4) RFL with patchy non-continuous sclerosis (Figure 4).
Figure 1. (a) Illustration of radiolucent fracture line (RFL) without sclerosis. (b) Anteroposterior and (c) lateral radiographs of the left femur
showing an RFL without sclerosis.
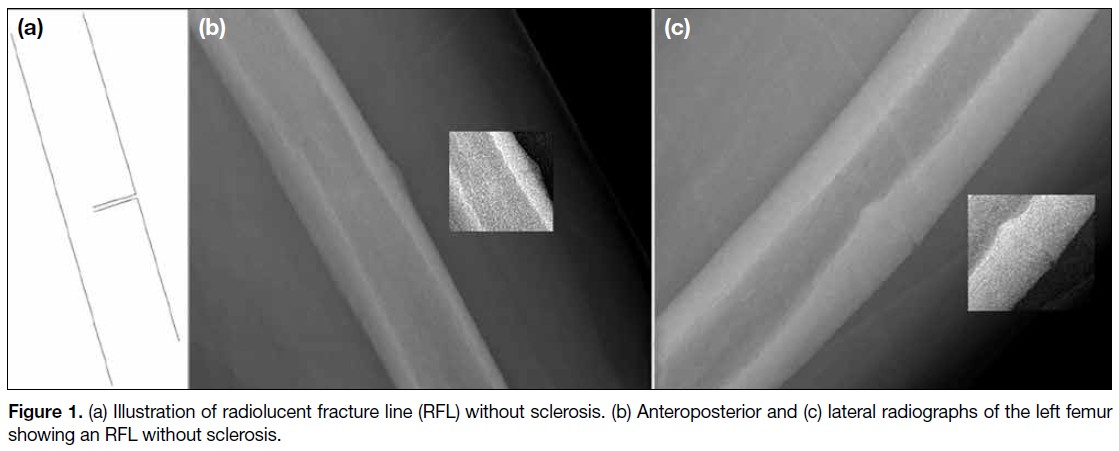
Figure 2. (a) Illustration of radiolucent fracture line
(RFL) showing linear sclerosis. (b) Lateral radiograph
of the left femur showing an RFL with linear sclerosis.
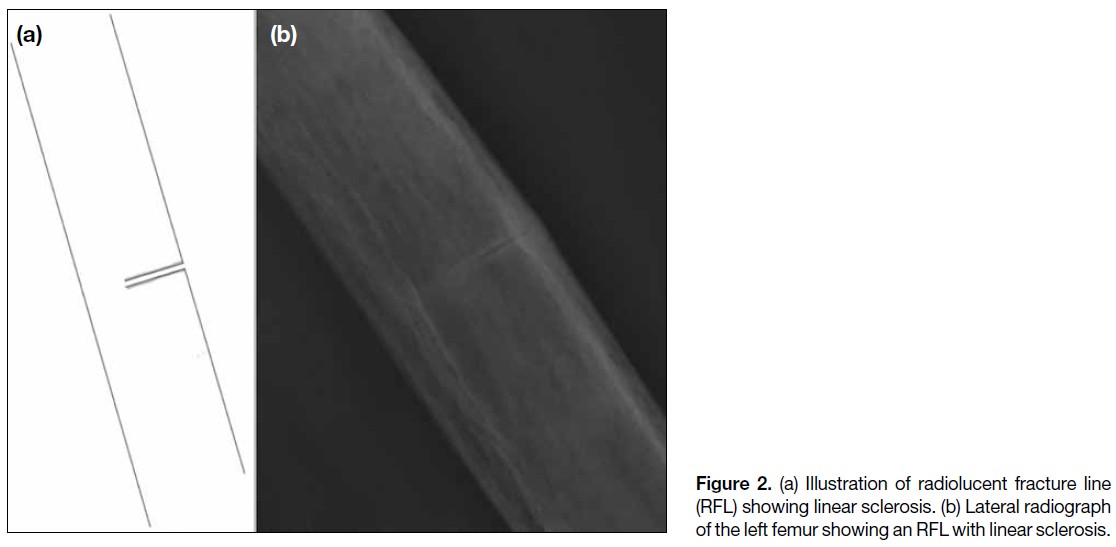
Figure 3. (a) Illustration of radiolucent fracture line (RFL) with patchy continuous sclerosis. (b) Anteroposterior and (c) lateral radiographs of
the left femur showing an RFL with patchy continuous sclerosis.
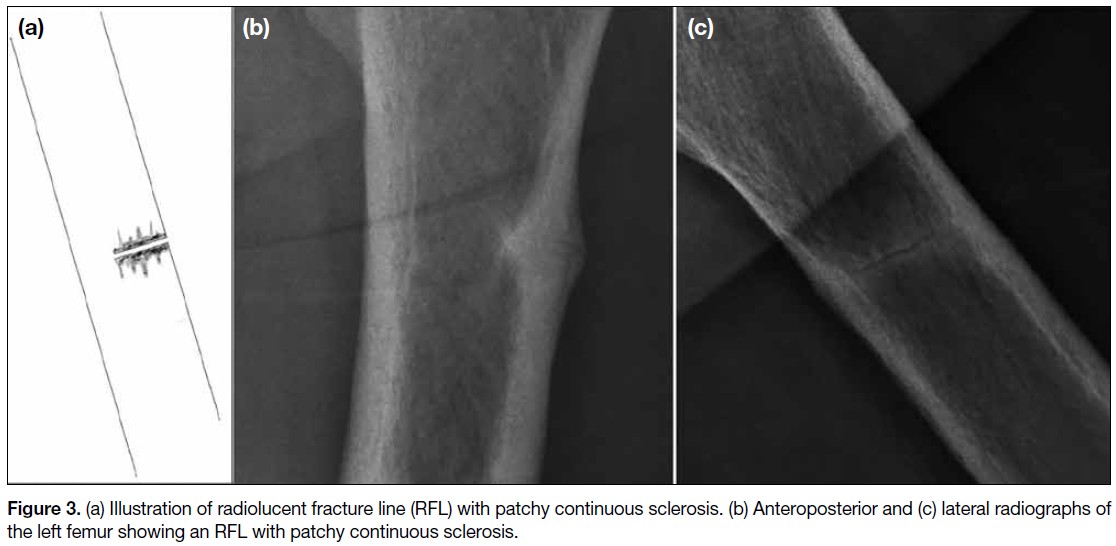
Figure 4. (a) Illustration of radiolucent fracture line (RFL) with patchy non-continuous sclerosis. (b) Anteroposterior and (c) lateral radiographs
of the left femur of the same patient in Figure 2 showing RFL with patchy non-continuous sclerosis.
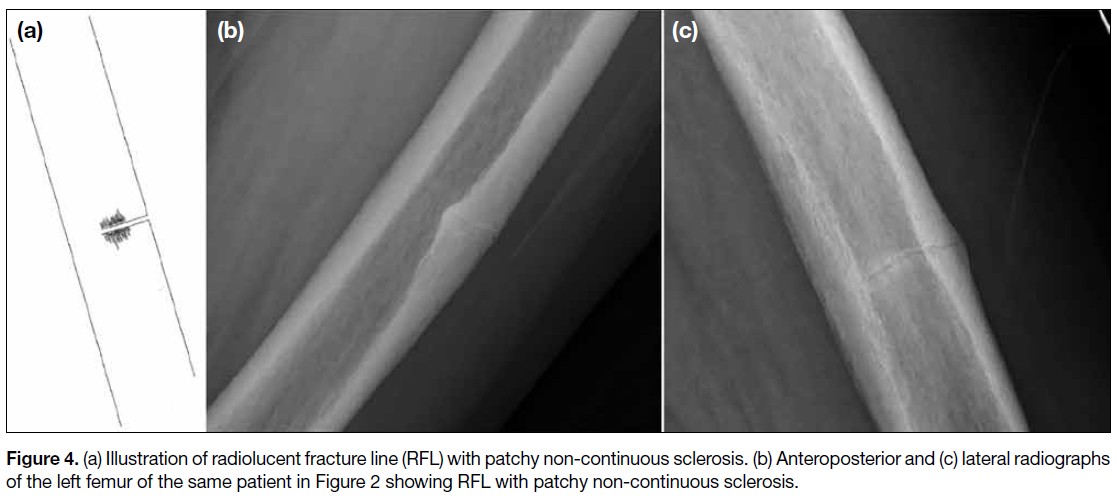
We recorded the location of each lesion, along with
the presence or absence of focal endosteal or periosteal
thickening. Cases were followed up until fixation was
required or a complete fracture occurred. Lesions were
classified as being located in either the subtrochanteric or
diaphyseal region, and further subdivided into proximal,
middle, or distal thirds. Observations were collected
independently by each of the same two authors and
correlated. In the event of any discrepancies, a senior
radiologist was consulted to provide a final decision.
Statistical Analyses
Pearson’s Chi squared test was used to compare
categorical data, while one-way analysis of variance was
employed to analyse continuous variables. Statistical
analyses were performed using SPSS (Windows
version 23.0; IBM Corp, Armonk [NY], US). Statistical
significance was defined as p < 0.05.
RESULTS
There were 100 radiographs of AFFs from 80 cases
available for review. Demographic and clinical data of
the study cohort are summarised in Table 1. There were
17 femurs in Group 1A, 35 femurs in Group 1B, and
48 femurs in Group 2. All 17 femurs with perilesional
sclerosis were independently identified by the two
authors previously described. There were no significant
differences among the three groups in terms of patient
demographics (age: p = 0.979); the patients were predominantly female and Asian. All had a history of
bisphosphonate use, except for two AFF cases with a
history of denosumab use only (one in Group 1A and
one in Group 2). There were no significant differences
in the duration of antiresorptive therapy (p = 0.418),
progression to complete fracture (p = 0.078), or
subsequent prophylactic fixation (p = 0.076) among the
three groups. The radiographic finding of perilesional
sclerosis was observed in 17 of the 100 femurs (17%),
with bilateral involvement in three patients who were all
female with a mean age of 66 years; two were Chinese
(88.2%) and the remaining patient was of Indian descent. The mean (± standard deviation) duration of
bisphosphonate use was 66 ± 31 months (range, 4-120).
Only one femur in Group 1A was from a patient with a
history of denosumab use without prior bisphosphonate
therapy. Bisphosphonate treatment was discontinued
upon diagnosis of AFF in all patients. Three femurs
(17.6%) subsequently progressed to complete fractures,
while six incomplete fractures required prophylactic
fixation (35.3%). The mean time
to surgical fixation or prophylactic fixation from the date
of presentation with perilesional sclerosis was 9 ± 12
months.
Table 1. Clinical data of the study cohort (n = 100).
The radiographic features of perilesional sclerosis in
Group 1A are summarised in Table 2. Each sclerotic
lesion was observed in an incomplete AFF and only
in the presence of an RFL. Perilesional sclerosis was
identified on lateral views in 15 femurs (88.2%), while
only nine femurs (52.9%) demonstrated sclerosis on
anteroposterior views. The lesions were mainly located
in the subtrochanteric region (n = 7, 41.2%), followed by
the proximal diaphyseal region (n = 6, 35.3%) and the
mid-diaphyseal region (n = 4, 23.5%). All lesions were
associated with either adjacent endosteal thickening or
periosteal thickening. Of the 17 lesions with perilesional
sclerosis, 16 (94.1%) were RFLs with patchy sclerosis
of varying widths along either side of the fracture line,
and 10 (58.8%) demonstrated patchy non-continuous
sclerosis.
Table 2. Radiographic features of perilesional sclerosis (n = 17).
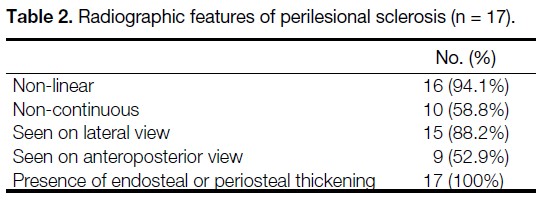
Among the 17 femurs with sclerotic RFLs, three had
earlier radiographs (mean, 56.4 months; range, 0.5-96.3)
showing an RFL without adjacent sclerosis, indicating
that perilesional sclerosis developed later. Once sclerosis
appeared, it persisted in all subsequent follow-up
radiographs. For the eight femurs that did not undergo
surgery, the mean duration between the first presentation
of RFL with perilesional sclerosis and the last available
radiograph was 31 ± 22 months (range, 0-57.6). Follow-up
was achieved for 100% of the 17 lesions, with a mean
follow-up duration of 72 ± 45 months (range, 8-184).
Regarding inter-observer variability, there was complete
agreement between both readers on the presence and
pattern of sclerosis.
DISCUSSION
Our study describes the presence of perilesional sclerosis
adjacent to the RFL, previously described by Png et al,[4]
and the radiological progression of AFFs in which
the RFL is recognised as the penultimate radiological
feature before progression to a complete fracture. We
observed that an RFL can be associated with, or may later
develop, perilesional sclerosis. This radiological feature
has not previously been documented in AFFs, which
are predominantly located between the subtrochanteric region and mid-diaphyseal regions of the femur, may be
bilateral and are consistently associated with endosteal or
periosteal thickening. In our study, perilesional sclerosis
appears to occur in approximately one-third of AFFs
with an RFL, and is usually seen on lateral radiographic
views, and occasionally on anteroposterior radiographic
views. While the variability in its appearance and its
significance remain largely unstudied, and descriptions in
the literature are scarce, our study presents observations
that may enhance our understanding of this entity.
AFFs are considered to be ‘tensional’ stress fractures,
typically initiating along the upper two-thirds of the
lateral femoral shaft corresponding to regions subjected
to greater tensional forces.[7] Accordingly, RFLs are better
observed as linear structures across the femoral diaphysis
on lateral views. As perilesional sclerosis appears to
occur in association with RFLs, this may account for its
notably high prevalence on lateral views of the femoral
shaft.
In the majority of our cases, perilesional sclerosis was
observed only on the lateral views. In two cases with
both anterior and lateral cortical thickening, sclerosis
was visible on both anteroposterior and lateral views.
These findings suggest that, in most cases, perilesional
sclerosis may be related to viewing cortical thickening
at right angles to its long axis. However, in two cases,
perilesional sclerosis was seen on the anteroposterior
views despite cortical thickening being confined to the
lateral cortex. This suggests that, in these cases, there
was focal sclerosis at the intracortical fracture margins.
Radiologically, sclerosis at fracture sites has been
described as a feature of fracture non-union.[8] Although
sclerosis has been postulated to be associated with
avascular necrosis or reduced metabolic bone activity,[9]
it has also been linked to prolonged time to union.[10]
Perilesional sclerosis has been mentioned in some
cases of insufficiency fractures but is rarely described
in AFFs. Only a single study by McKenna et al[11]
described sclerosis in relation to AFFs, but only on
computed tomography scans without specific reference
to its relationship with RFLs. The fact that this feature
is observed only in a subset of incomplete AFFs with
variable continuity along the RFL, suggests that it may
represent a phase in the pathophysiological progression
of AFFs.
Perilesional sclerosis associated with cortical thickening
may resemble that seen in stress or fatigue fractures. However, cases with intracortical perilesional sclerosis
may represent an early phase of the process leading to
non-union. Fracture non-union is usually associated with
sclerosis at the fracture margins, and the two cases in our
cohort where sclerosis was confined to the lateral cortex
may represent non-union of the incomplete fracture, akin
to hypertrophic non-union involving the lateral cortex.
This may be the result of persistent tensile stresses that
inhibit bony union.[12] These lesions also appeared to
progress from an isolated RFL to an RFL with adjacent
sclerosis, with this radiographic feature persisting for a
mean duration of 31 ± 22 months. Perilesional sclerosis
may take considerable time to develop but can persist
long after initial presentation. We postulate that it could
represent the development of a chronic non-union state in
incomplete AFFs. Bisphosphonates such as alendronate
are known to have prolonged effects on osteoclast
function, and these may continue long after cessation of
therapy.[13]
Although there were no significant differences in the
proportion of cases that progressed to complete fracture
or required prophylactic fixation between Group 1A and
Group 1B, a higher rate of surgical fixation in Group 1B
was noted (65.7% vs. 52.9%). A histological study by
Schilcher et al[14] demonstrated signs of attempted healing
at the site of AFFs; however, the current literature does not
explain the pathological differences between AFFs that
eventually heal and those that do not. Future histological
studies could examine samples of perilesional sclerosis
to explore the underlying pathology and provide insights
into its clinical significance.
Strengths and Limitations
A strength of this study is the 100% follow-up rate
over a mid-term duration for a previously undescribed
radiological finding in AFFs. The main limitation is the
limited sample size of patients with perilesional sclerosis,
although this may reflect the low prevalence of AFFs
among patients on antiresorptive therapy. Additionally,
the predominance of female patients in the cohort
limited our ability to assess potential gender-related
differences. Another limitation is the irregular follow-up
of patients due to variation in individual physicians’
clinical practices and the retrospective nature of the
study. Longer-term, regularly scheduled follow-up with
standardised radiographic imaging should be considered
in future studies to better evaluate the relationship
between these lesions and fracture outcomes.
CONCLUSION
We describe perilesional sclerosis as a previously
unrecognised radiological feature along the RFL, in
incomplete AFFs with distinctive characteristics. Its
presence may suggest a state of non-union and was
observed in approximately one-third of cases with an
RFL. Further research involving larger cohorts could
shed light on its pathophysiological and prognostic
significance.
REFERENCES
1. Shane E, Burr D, Ebeling PR, Abrahamsen B, Adler RA,
Brown TD, et al. Atypical subtrochanteric and diaphyseal femoral
fractures: report of a task force of the American Society for Bone
and Mineral Research. J Bone Miner Res. 2010;25:2267-94.
Crossref
2. Shane E, Burr D, Abrahamsen B, Adler RA, Brown TD,
Cheung AM, et al. Atypical subtrochanteric and diaphyseal
femoral fractures: second report of a task force of the American
Society for Bone and Mineral Research. J Bone Miner Res.
2014;29:1-23.
Crossref
3. Mohan PC, Howe TS, Koh JS, Png MA. Radiographic features of
multifocal endosteal thickening of the femur in patients on long-term bisphosphonate therapy. Eur Radiol. 2013;23:222-7.
Crossref
4. Png MA, Mohan PC, Koh JS, Howe CY, Howe TS. Natural
history of incomplete atypical femoral fractures in patients after a prolonged and variable course of bisphosphonate therapy—a long-term radiological follow-up. Osteoporos Int. 2019;30:2417-28.
Crossref
5. Yang KH, Min BW, Ha YC. Atypical femoral fracture: 2015
position statement of the Korean Society for Bone and Mineral
Research. J Bone Metab. 2015;22:87-91.
Crossref
6. Hedge G, Thaker S, Botchu R, Fawcett R, Gupta H. Atraumatic
fractures of the femur. Br J Radiol. 2021;94:20201457.
Crossref
7. Koh JS, Goh SK, Png MA, Ng AC, Howe TS. Distribution
of atypical fractures and cortical stress lesions in the femur:
implications on pathophysiology. Singapore Med J. 2011;52:77-80.
8. Gharu E, John B. Nonunion of fractures: a review of epidemiology, diagnosis, and clinical features in recent literature. Indian J Orthop. 2024;58:1680-5.
Crossref
9. Jones W, Roberts RE. Pathological calcification and ossification in relation to Leriche and Policard’s theory. Proc R Soc Med. 1933;26:853-9.
Crossref
10. Schmidle G, Ebner HL, Klauser AS, Fritz J, Arora R, Gabl M.
Correlation of CT imaging and histology to guide bone graft
selection in scaphoid non-union surgery. Arch Orthop Trauma
Surg. 2018;138:1395-405.
Crossref
11. McKenna MJ, Heffernan E, Hurson C, McKiernan FE. Clinician
approach to diagnosis of stress fractures including bisphosphonateassociated
fractures. QJM. 2014;107:99-105.
Crossref
12. Andrzejowski P, Giannoudis PV. The ‘diamond concept’ for long
bone non-union management. J Orthop Traumatol. 2019;20:21.
Crossref
13. Stock JL, Bell NH, Chesnut CH 3rd, Ensrud KE, Genant HK,
Harris ST, et al. Increments in bone mineral density of the lumbar
spine and hip and suppression of bone turnover are maintained after
discontinuation of alendronate in postmenopausal women. Am J
Med. 1997;103:291-7.
Crossref
14. Schilcher J, Sandberg O, Isaksson H, Aspenberg P. Histology of 8 atypical femoral fractures: remodeling but no healing. Acta Orthop. 2014;85:280-6.
Crossref
CASE REPORTS
Perineural and Muscular Involvement in Recurrent Diffuse Large B-Cell Lymphoma Detected by Fluorine-18 Fluorodeoxyglucose Positron Emission Tomography/Computed Tomography: A Case Report
CASE REPORT
Hong Kong J Radiol 2026 Mar;29(1):e30-3 | Epub 26 February 2026
Perineural and Muscular Involvement in Recurrent Diffuse Large
B-Cell Lymphoma Detected by Fluorine-18 Fluorodeoxyglucose
Positron Emission Tomography/Computed Tomography: A Case
Report
JHY Lau, KK Ng, BT Kung
Nuclear Medicine Unit, Department of Diagnostic and Interventional Radiology, Queen Elizabeth Hospital,
Hong Kong SAR, China
Correspondence: Dr JHY Lau, Nuclear Medicine Unit, Department of Diagnostic and Interventional Radiology, Queen Elizabeth
Hospital, Hong Kong SAR, China. Email: hugh.lau@ha.org.hk
Submitted: 16 December 2024; Accepted: 5 September 2025.
Contributors: All authors designed the study. JHYL acquired the data. All authors analysed the data. JHYL drafted the manuscript. KKN and
BTK critically revised the manuscript for important intellectual content. All authors had full access to the data, contributed to the study, approved
the final version for publication, and take responsibility for its accuracy and integrity.
Conflicts of Interest: All authors have disclosed no conflicts of interest.
Funding/Support: This study received no specific grant from any funding agency in the public, commercial, or not-for-profit sectors.
Data Availability: All data generated or analysed during the present study are available from the corresponding author on reasonable request.
Ethics Approval: This study was approved by the Central Institutional Review Board of Hospital Authority, Hong Kong (Ref No.: CIRB-2024-313-4). The requirement for patient consent was waived by the Board as the patient was deceased and no contact information for next of kin
was available. The study involved retrospective review of anonymised clinical data only and posed no risk to subjects. All data were handled in
accordance with Hospital Authority policies on data privacy and security.
CASE PRESENTATION
A 79-year-old female with a past medical history of
hypertension and impaired fasting glucose presented to
our institution in April 2020 with a neck mass and fever.
She was an ex-smoker with no known drug allergies.
Following an ear, nose, and throat consultation, she was
diagnosed with stage 4B diffuse large B-cell lymphoma
(DLBCL). A biopsy of the left tonsil revealed high-grade
B-cell lymphoma, consistent with DLBCL. Further
evaluation including bilateral bone marrow aspiration
and bilateral trephine biopsy showed no evidence of
lymphoma involvement.
Staging fluorine-18 fluorodeoxyglucose positron
emission tomography/computed tomography (18F-FDG
PET/CT) revealed hypermetabolic lymphadenopathy on
both sides of the diaphragm, consistent with the biopsy-proven lymphoma, as well as hypermetabolic lesions in bilateral tonsils, confirming lymphomatous involvement
(Figure 1).
Figure 1. Staging fluorine-18 fluorodeoxyglucose positron emission tomography/computed tomography (18F-FDG PET/CT) in a patient with
biopsy-proven diffuse large B-cell lymphoma. (a) Maximum intensity projection shows multiple hypermetabolic, enlarged lymph nodes on
both sides of the diaphragm. Transaxial (b and c) plain CT and (d and e) fused PET/CT images show supradiaphragmatic involvement, and
transaxial (f) plain CT and (g) fused PET/CT images show infradiaphragmatic involvement.

The patient commenced R-CHOP chemotherapy
(rituximab, cyclophosphamide, doxorubicin, vincristine,
and prednisone), receiving six cycles over 5 months.
The first cycle was administered at 50% dosage, with
subsequent cycles adjusted for tolerance and side-effects.
Following completion of the last cycle, an
end-of-treatment 18F-FDG PET/CT scan demonstrated
complete metabolic remission, with a Deauville score of
2 (Figure 2).
Figure 2. Fluorine-18 fluorodeoxyglucose positron emission tomography/computed tomography (18F-FDG PET/CT) following treatment with
R-CHOP chemotherapy (rituximab, cyclophosphamide, doxorubicin, vincristine, and prednisone). (a) Maximum intensity projection shows
significant metabolic improvement or resolution on both sides of the diaphragm. Transaxial (b) plain CT and (c) fused PET/CT images show
resolved supradiaphragmatic lymph nodes, and transaxial (d) plain CT and (e) fused PET/CT images show resolved infradiaphragmatic
lymph nodes.
Five months after completing R-CHOP chemotherapy,
the patient developed a right neck mass and numbness
over the right side of her neck and right lower limb, with
muscle power graded at 2 out of 5. A CT scan revealed a
large soft tissue mass on the right side of the oropharynx, and biopsy confirmed DLBCL with CD20 positivity. A
subsequent 18F-FDG PET/CT scan for restaging revealed
a new hypermetabolic soft tissue mass in the right side
of the oropharynx, consistent with lymphomatous
involvement, with a Deauville score of 5. Notably, the scan also revealed new, multiple hypermetabolic
foci involving perineural and muscular involvements
in the bilateral head and neck regions and the right
proximal lower limb, raising suspicion for perineural
lymphomatous infiltration (Figure 3).
Figure 3. Recurrence and suspected atypical lymphomatous involvement in neuromuscular regions. (a) Maximum intensity projection
of the fluorine-18 fluorodeoxyglucose positron emission tomography/computed tomography (18F-FDG PET/CT) shows a hypermetabolic
right oropharyngeal lesion (arrow). Transaxial (b) plain CT and (c) fused PET/CT images show the corresponding hypermetabolic lesion
(arrows). Transaxial (d) plain CT and (e) fused PET/CT images show hypermetabolic left perineural involvement along the distribution of the
left trigeminal branches (arrows). (f) Maximum intensity projection shows a hypermetabolic right neck perineural and muscular lesion (red
arrow) and a right lower limb perineural and muscular lesion (purple arrow). Transaxial (g) plain CT and (h) fused PET/CT images show a
hypermetabolic right neck neuromuscular lesion over the right trapezius muscle and accessory nerve region (arrows). Transaxial (i) plain CT
and (j) fused PET/CT images show a hypermetabolic right lower limb neuromuscular lesion in the region of the right sciatic nerve (arrows).
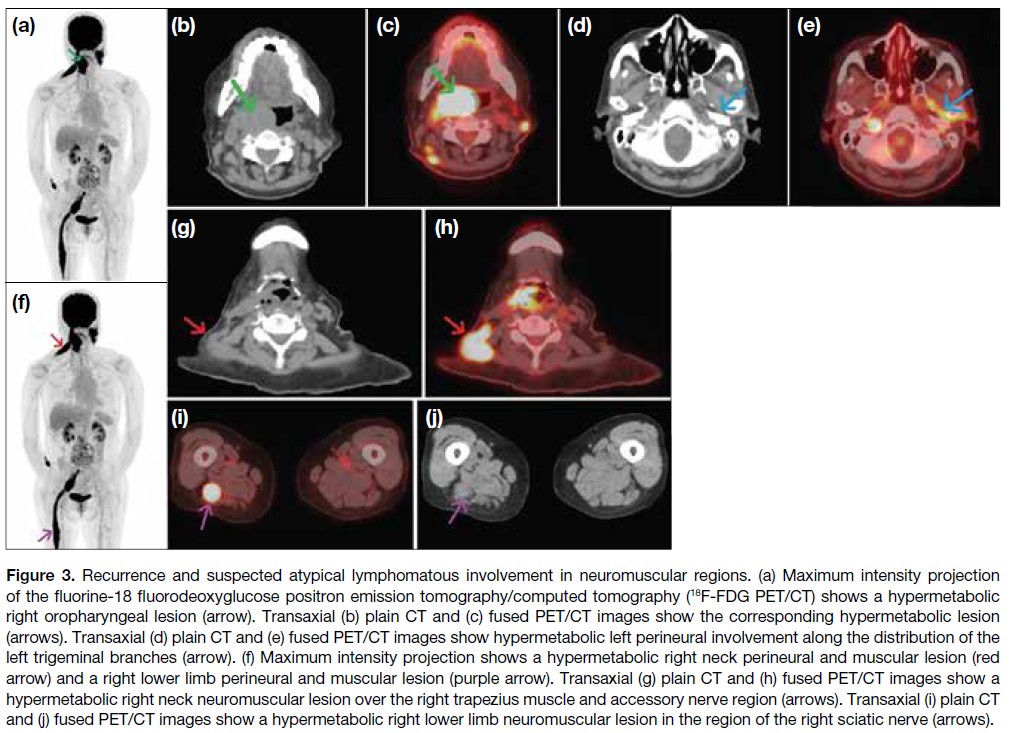
The patient subsequently received six cycles of
R-IMVP-16 (rituximab, ifosfamide, methotrexate,
etoposide, and prednisone) over 5 months. End-of-treatment 18F-FDG PET/CT showed metabolic
resolution of the right tonsillar/oropharyngeal mass and
other infiltrative perineural lesions in the neck region
and right lower limb, indicating a favourable treatment
response (Figure 4). Clinically, her numbness subsided,
with improved sensation in the previously affected
regions and right lower limb power improved to 4 out
of 5, consistent with the 18F-FDG PET/CT findings.
Both clinical and imaging findings favoured a positive
treatment response of the perineural and muscular
lymphomatous involvement in this patient with recurrent
lymphoma.
Figure 4. Maximum intensity
projection of fluorine-18
fluorodeoxyglucose positron
emission tomography/computed
tomography with significant
metabolic improvements or
resolutions of the oropharynx,
right neck and right lower
limb hypermetabolic lesions
after treated with R-IMVP-16
(rituximab, ifosfamide,
methotrexate, etoposide, and
prednisone) chemotherapy.
DISCUSSION
Perineural and muscular involvement in DLBCL is
rare, with only a limited number of cases reported in
the literature.[1] The underlying mechanisms are not fully understood, but it is believed that DLBCL may infiltrate
muscle tissue either via a haematogenous route or through
adjacent lymphatic structures.[2] Clinical manifestations
can vary widely, with patients presenting with muscle
weakness, myalgia, or neuropathic symptoms.[3]
Differential diagnoses for FDG-avid perineural and
muscular lesions include polyneuritis, compartment-related
compression radiculopathy, and tuberculosis.
In polyneuritis, the pattern of increased FDG uptake is
usually symmetrical and occurs without associated soft
tissue thickening.[4] [5] The significant soft tissue thickening
in our case made compartment-related compression
radiculopathy less likely. Active tuberculosis was
excluded through microbiological investigations.
This case demonstrated that the patient’s neuropathic
symptoms and imaging findings were indicative of
perineural and muscular involvement. The identification
of hypermetabolic activity in the muscles on 18F-FDG
PET/CT was crucial in establishing the diagnosis due to
the asymmetrical metabolic distribution and soft tissue
thickening in the affected regions. These abnormalities
resolved in parallel with the biopsy-proven recurrent
right oropharynx DLBCL, both metabolically and
morphologically. Such findings are often mistaken for
primary myopathies or neuropathies.
In our case, 18F-FDG PET/CT not only confirmed the
recurrence of DLBCL but also revealed the unusual sites
of perineural and muscular involvement. This underscores
the importance of considering extranodal manifestations
of DLBCL, as it ultimately guided treatment decisions.
Furthermore, the most recent 18F-FDG PET/CT
showed both metabolic and morphological resolution
of the hypermetabolic perineural and muscular lesions,
supporting the diagnosis of atypical lymphomatous
involvement and reflecting a significant treatment
response.
Previous studies[6] [7] revealed that perineural and muscular
involvement in DLBCL is largely underreported,
with only a limited number of cases documented—primarily in patients with advanced-stage disease—and
highlighted the importance of recognising 18F‑FDG
PET/CT findings in atypical sites of lymphomatous
involvement to avoid misdiagnosis and ensure
appropriate management. Primary muscular lymphoma[6]
and other atypical sites of DLBCL involvement[6] [7] have
also been reported.
The utility of 18F-FDG PET/CT in the staging and treatment monitoring of DLBCL has been examined,[8] [9]
which concluded that this imaging modality provides
valuable insights into disease burden and can identify sites
of active disease that may not be evident on conventional
imaging. This aligns with our case, in which 18F-FDG
PET/CT played a pivotal role in diagnosing perineural
and muscular involvement in a one-stop-shop manner.
The management of DLBCL with perineural and
muscular involvement is complex and often requires
a multidisciplinary approach.[10] [11] Treatment options
may include chemotherapy, radiotherapy, and targeted
therapies, depending on the extent of disease and the
patient’s overall health.
In our case, the patient was commenced on a salvage
chemotherapy regimen following relapse of DLBCL.
Given the aggressive nature of her disease, close
monitoring with repeat 18F-FDG PET/CT was planned
to assess treatment response. The prognosis for patients
with perineural and muscular involvement in DLBCL
varies, but early detection and timely intervention can
significantly improve clinical outcomes.
CONCLUSION
This case highlights the importance of 18F-FDG PET/CT in detecting perineural and muscular involvement in
patients with recurrent DLBCL. Early detection of the
disease involvement using 18F-FDG PET/CT can guide
biopsy targeting, inform appropriate treatment strategies
and serve as a reference for assessing treatment response
on end-of-treatment imaging, all of which are crucial for
improving patient outcomes.
REFERENCES
1. Lim AT, Clucas D, Khoo C, Parameswaran BK, Lau E.
Neurolymphomatosis: MRI and 18FDG-PET features. J Med
Imaging Radiat Oncol. 2016;60:92-5
Crossref
2. Murthy NK, Amrami KK, Broski SM, Johnston PB, Spinner RJ.
Perineural spread of peripheral neurolymphomatosis to the cauda
equina. J Neurosurg Spine. 2021;36:464-9.
Crossref
3. Broski SM, Bou-Assaly W, Gross MD, Fig LM. Diffuse skeletal
muscle F-18 fluorodeoxyglucose uptake in advanced primary
muscle non-Hodgkin’s lymphoma. Clin Nucl Med. 2009;34:251-3.
Crossref
4. Xie X, Cheng B, Han X, Liu B. Findings of multiple neuritis on
FDG PET/CT imaging. Clin Nucl Med. 2013;38:67-9. Crossref
5. Ankrah AO, Glaudemans AW, Maes A, Van de Wiele C,
Dierckx RA, Vorster M, et al. Tuberculosis. Semin Nucl Med.
2018;48:108-30.
Crossref
6. Iioka F, Tanabe H, Honjo G, Misaki T, Ohno H. Resolution of
bone, cutaneous, and muscular involvement after haploidentical
hematopoietic stem cell transplantation followed by post-transplant
cyclophosphamide in adult T-cell leukemia/lymphoma. Clin Case
Rep. 2020;8:1553-9.
Crossref
7. Belmonte G, Caldarella C, Hohaus S, Manfredi R, Minordi LM. Muscle recurrence of a primarily nodal follicular lymphoma
studied by contrast-enhanced 18F-FDG PET/CT. Clin Nucl Med.
2020;45:65-7.
Crossref
8. Kostakoglu L, Cheson BD. Current role of FDG PET/CT in
lymphoma. Eur J Nucl Med Mol Imaging. 2014;41:1004-27.
Crossref
9. Jing F, Liu Y, Zhao X, Wang N, Dai M, Chen X, et al. Baseline
18F-FDG PET/CT radiomics for prognosis prediction in diffuse large B cell lymphoma. EJNMMI Res. 2023;13:92.
Crossref
10. Adams HJ, Kwee TC. Prognostic value of interim FDG-PET in
R-CHOP–treated diffuse large B-cell lymphoma: systematic review
and meta-analysis. Crit Rev Oncol Hematol. 2016;106:55-63.
Crossref
11. Wai SH, Lee ST, Cliff ER, Bei M, Lee J, Hawkes EA, et al. Utility
of FDG-PET in predicting the histology of relapsed or refractory
lymphoma. Blood Adv. 2024;8:736-45.
Crossref
Urachal Adenocarcinoma in a Young Adult: A Rare Case Report
CASE REPORT
Hong Kong J Radiol 2026 Mar;29(1):e34-7 | Epub 26 February 2026
Urachal Adenocarcinoma in a Young Adult: A Rare Case Report
LLA Chan, IS Bandong
Institute of Radiology, St Luke’s Medical Center–Quezon City, Quezon City, The Philippines
Correspondence: Dr LLA Chan, Institute of Radiology, St Luke’s Medical Center–Quezon City, Quezon City, The Philippines. Email: llachan@stlukes.com.ph
Submitted: 12 February 2025; Accepted: 28 April 2025.
Contributors: LLAC designed the study, acquired and analysed the data, and drafted the manuscript. ISB critically revised the manuscript for
important intellectual content. Both authors had full access to the data, contributed to the study, approved the final version for publication, and
take responsibility for its accuracy and integrity.
Conflicts of Interest: Both authors have disclosed no conflicts of interest.
Funding/Support: This study received no specific grant from any funding agency in the public, commercial, or not-for-profit sectors.
Data Availability: All data generated or analysed during the present study are available from the corresponding author on reasonable request.
Ethics Approval: This study was approved by the Institutional Ethics Review Committee of St Luke’s Medical Center–Quezon City, The
Philippines (Ref No.: SL-21346). The patient was treated in accordance with the Declaration of Helsinki. Informed consent for publication of
this case report and the accompanying images was obtained from the patient’s mother, as the patient is deceased.
CASE PRESENTATION
A 19-year-old female presented to our institution in
February 2023 with intermittent gross haematuria
and dysuria for 2 months without seeking medical
consultation. She then experienced a syncopal attack,
prompting consultation and eventual admission. Her
medical history included recurrent untreated urinary
tract infections since childhood. No family history of
malignancy or prior abdominal surgery was noted.
Initial transvaginal ultrasound revealed a solid, slightly
irregular ovoid mass measuring 6.9 × 5.9 × 4.7 cm3,
located in the posterior bladder wall (Figure 1a). The
mass exhibited heterogeneous echogenicity with
punctate calcifications. Doppler ultrasound revealed
moderate vascularity (Figure 1b). The ovaries, adnexa,
and uterus appeared unremarkable.
Figure 1. Transvaginal ultrasonography. (a) Slightly irregular ovoid solid mass (arrows) extending from the posterior urinary bladder wall,
measuring 6.9 × 5.9 × 4.7 cm3. (b) Doppler interrogation showing moderate vascularity of the mass (arrow).
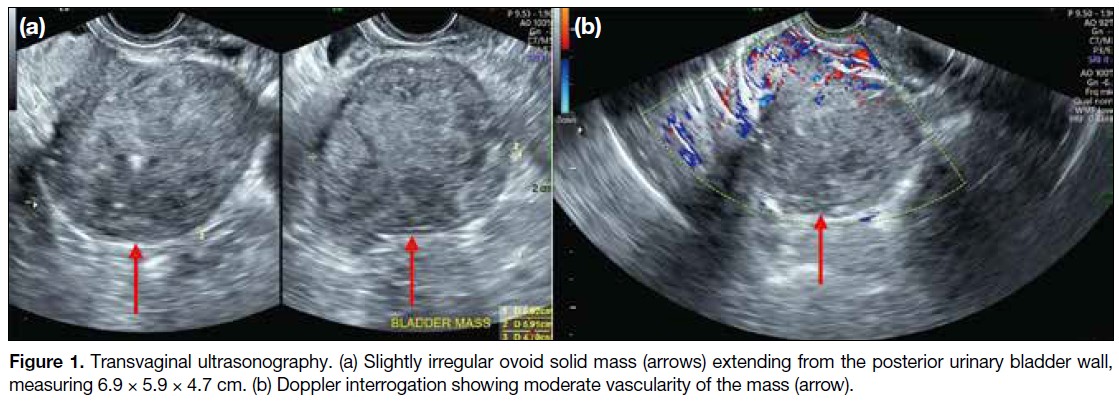
A subsequent computed tomography (CT) urography
(Figure 2) revealed a lobulated, heterogeneously
enhancing mass in the supravesical region with associated
calcifications. The mass abutted the bladder dome with
obliteration of the fat plane, suggesting infiltration. A
1.8-cm enlarged lymph node was also noted in the right
paravesical region. A urachal neoplasm was considered.
Figure 2. Contrast-enhanced multi-slice
computed tomography urography
in (a) axial, (b) coronal, and (c) sagittal
views. A well-defined lobulated non-enhancing
mass with intrinsic punctate
calcifications (arrows) is seen at the
supravesical region with involvement of
the bladder dome. The mass is slightly
less attenuating than the adjacent soft
tissue, a finding suggestive of a mucus-filled
structure.
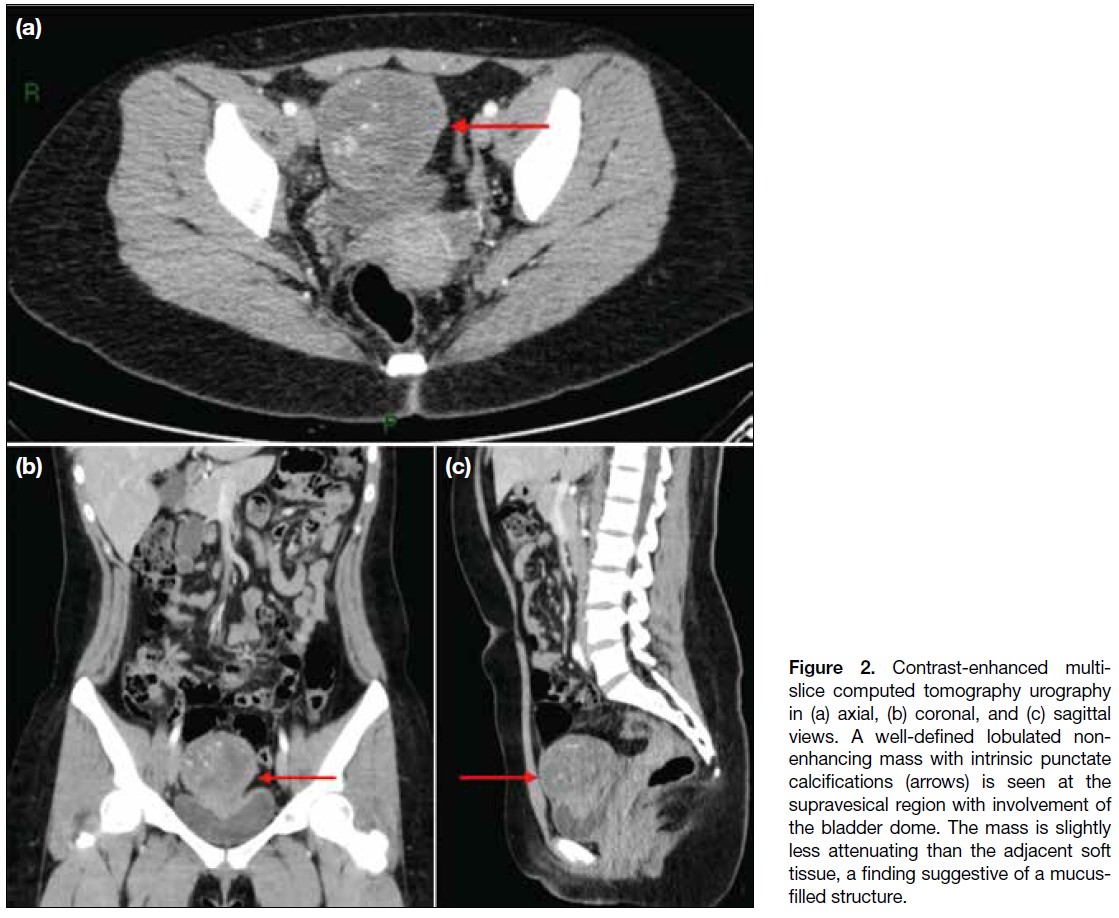
The patient underwent radical cystectomy and total
abdominal hysterectomy with bilateral salpingectomy,
all of which were well tolerated without complications.
Histopathological examination of the excised mass
revealed a moderately differentiated mucinous
adenocarcinoma, consistent with urachal carcinoma.
Histopathological Findings
The mass was located approximately 6 cm from the
umbilicus, with smooth external surfaces and yellow-tan
friable content. Histological analysis showed malignant
epithelial cells arranged in glandular and cribriform
patterns, with extensive extracellular mucin and areas
of tumour necrosis (Figure 3). The tumour infiltrated
the bladder’s lamina propria, muscularis propria, and
perivesical fat. These findings were consistent with
mucinous adenocarcinoma, a type of urachal carcinoma.
Figure 3. Haematoxylin and eosin–stained (H&E) histopathological
sections. (a) Low-power objective (×10) showing a histologically
normal transitional epithelium seen in the urinary bladder and
urachus (red asterisk) adjacent to malignant adenocarcinoma
(yellow asterisk). (b) High-power objective (×40) showing features
of adenocarcinoma, characterised by malignant epithelial cells in
glandular and cribriform patterns and small nests. (c) High-power
objective (×40) also shows abundant extracellular mucin (green
asterisk) and extensive tumour necrosis (red asterisk) are also noted
surrounding the malignant epithelial cells (yellow asterisk).
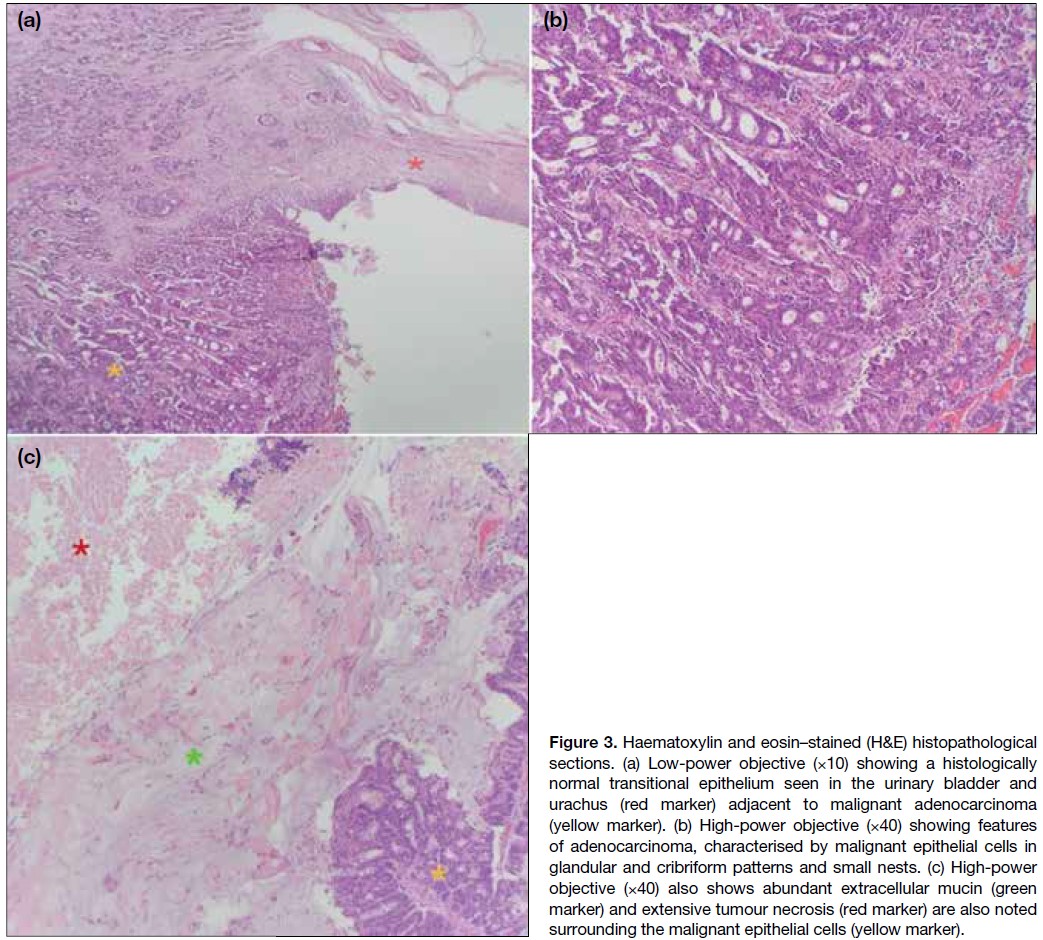
Postoperative Course and Outcome
Following surgery, the patient’s recovery was uneventful.
She was eventually discharged and underwent
three cycles of chemotherapy comprising FOLFOX
(leucovorin, 5-fluorouracil, and oxaliplatin). Eighteen
months after surgery, she was frequently admitted with
recurrent urinary tract infections that were found to be caused by a newly discovered metastatic growth on the
anterior pelvic wall, compressing the urinary collecting
system. The patient underwent palliative care and
eventually deceased within a year.
DISCUSSION
Urachal adenocarcinoma is a very rare primary bladder
neoplasm, accounting for only 0.35% to 0.7% of all
primary bladder cancers.[1] This malignancy tends to have a male predilection and typically occurs in adults
between 40 and 70 years old. The most common clinical
feature is haematuria, as seen in the index patient. Other
signs and symptoms include dysuria, abdominal pain, a
suprapubic mass, and discharge of blood, pus, or mucus
from the umbilicus.[2] Only six adult cases of urachal
adenocarcinoma diagnosed before the age of 30 years
have been reported in the English literature, with the
youngest diagnosed at age 26 years.[1] [3] [4] [5] [6]
Ultrasonography is often performed as the initial
imaging modality and can provide a general impression
of the lesion, including its location and characteristics.[7]
Sonographic imaging features of urachal adenocarcinoma include: (1) a solid mass extending between the dome
of the bladder and the abdominal wall, with an irregular
shape and bladder wall invasion; (2) a hypoechoic,
heterogeneous echo pattern with a small amount of
calcification; and (3) patchy, short-line blood flow signals
within the mass.[8] These characteristic features were
analogous to those seen on the initial ultrasonography
performed in our patient.
CT imaging can be used to confirm the ultrasonographic
findings or serve as the first-line imaging to evaluate
local disease, tumour extension, and the presence of
pelvic lymph node involvement or distant metastases.[7]
A key diagnostic feature of urachal adenocarcinoma on CT is its supravesical midline location. The mass
often demonstrates predominantly low attenuation,
attributable to its mucinous content found on pathological
examination. Calcifications are also commonly seen in
mucinous tumours.[9] These findings closely correspond
to the appearance and location of the tumour in the index
patient’s CT urography.
Although urachal remnants are lined by urothelial
epithelium, 80% of urachal cancers are adenocarcinomas,
including mucin-producing (69%) and mucin-negative
(15%) subtypes.[7] The reason why adenocarcinoma is the
predominant malignant epithelial type in urachal cancers
remains unclear, but it has been hypothesised that
chronic irritation may induce malignant transformation
of transitional epithelium into columnar epithelium.[7]
Another theory proposes that intestinal metaplasia
in the urinary bladder is associated with cytogenetic
abnormalities and significant telomere shortening
relative to telomere length in adjacent normal urothelial
cells.[10] These theories may help explain how urachal
adenocarcinoma can, albeit rarely, present in a younger
demographic, such as in the case of the index patient
who experienced recurrent urinary tract infections and
was therefore subject to d from childhood.
Differential diagnoses for urachal adenocarcinoma
include ovarian malignancies and other types of urinary
bladder cancer. Sonographic and CT findings of these
malignancies may reveal large, complex masses similar to
the radiographic findings of urachal adenocarcinoma.[11] [12] [13]
Nonetheless, the key feature that supports a diagnosis of
urachal adenocarcinoma over other possibilities is the
supravesical midline location of the mass.
Surgery remains the mainstay of treatment for urachal
adenocarcinoma. For muscle-invasive disease, radical
cystectomy with en bloc resection of the urachal
ligament may be the only curative option. Nonetheless,
survival still strongly correlates with the stage and grade
of the disease. A study reported a 5-year survival rate of
50% for stage I to III tumours, while no stage IV patients
survived beyond 2 years.[11] Urachal adenocarcinoma has
also been found to be resistant to chemotherapy and radiotherapy; therefore, early definitive diagnosis and
radical resection are essential for a better outcome.[11]
CONCLUSION
Urachal carcinoma is a rare and aggressive malignancy
that should be considered in the differential diagnosis
of pelvic masses, even in young patients. The rarity of
this condition highlights the importance of radiological
imaging in early detection. Ultrasonography and CT are
essential for identifying the tumour and assessing its
extent. Although surgical resection remains the treatment
of choice, the prognosis is generally poor, underscoring
the need for further research into effective therapies for
this rare and challenging type of cancer.
REFERENCES
1. Gopalan A, Sharp DS, Fine SW, Tickoo SK, Herr HW, Reuter VE, et al. Urachal carcinoma: a clinicopathologic analysis of 24 cases with outcome correlation. Am J Surg Pathol. 2009;33:659–68.
Crossref
2. Chen X, Kang C, Zhang M. Imaging features of urachal cancer: a case report. Front Oncol. 2019;9:1274.
Crossref
3. Henly DR, Farrow GM, Zincke H. Urachal cancer: role of conservative surgery. Urology. 1993;42:635–9.
Crossref
4. Lee SR, Kang H, Kang MH, Yu YD, Choi CI, Choi KH, et al. The youngest Korean case of urachal carcinoma. Case Rep Urol. 2015;2015:707456.
Crossref
5. Pinthus JH, Haddad R, Trachtenberg J, Holowaty E, Bowler J, Herzenberg AM, et al. Population based survival data on urachal tumors. J Urol. 2006;175:2042–7.
Crossref
6. Machida H, Ueno E, Nakazawa H, Fujimura M, Kihara T.
Computed tomographic appearance of urachal carcinoma associated
with urachal diverticulum misdiagnosed by cystoscopy. Abdom
Imaging. 2008;33:363-6.
Crossref
7. Parada Villavicencio C, Adam SZ, Nikolaidis P, Yaghmai V,
Miller FH. Imaging of the urachus: anomalies, complications, and
mimics. Radiographics. 2016;36:2049-63.
Crossref
8. Koster IM, Cleyndert P, Giard RW. Best cases from the AFIP:
urachal carcinoma. Radiographics. 2009;29:939-42.
Crossref
9. Brick SH, Friedman AC, Pollack HM, Fishman EK, Radecki PD,
Siegelbaum MH, et al. Urachal carcinoma: CT findings. Radiology.
1988;169:377-81.
Crossref
10. Lim H, Lusaya D. Urachal mucinous adenocarcinoma of the
bladder. Philipp J Urol. 2020;28:115-7.
11. Marko J, Marko KI, Pachigolla SL, Crothers BA, Mattu R,
Wolfman DJ. Mucinous neoplasms of the ovary: radiologic-pathologic
correlation. Radiographics. 2019;39:982-97.
Crossref
12. Wong-You-Cheong JJ, Woodward PJ, Manning MA, Sesterhenn IA.
From the Archives of the AFIP: neoplasms of the urinary bladder:
radiologic-pathologic correlation. Radiographics. 2006;26:553-80.
Crossref
13. Varma V, Myers DT. Urachal adenocarcinoma. Appl Radiol.
2019;48:44-5.
Crossref
Salvaging Inadvertent Subintimal Stenting with Double-Barrel Subintimal Stenting: A Case Report
CASE REPORT
Hong Kong J Radiol 2026 Mar;29(1):e38-43 | Epub 10 March 2026
Salvaging Inadvertent Subintimal Stenting with Double-Barrel Subintimal Stenting: A Case Report
ES Lo1, SC Woo1, SKH Wong1, LF Cheng1, KM Chan2, WK Ng2
1 Department of Radiology, Princess Margaret Hospital, Hong Kong SAR, China
2 Vascular Surgery Department, Princess Margaret Hospital, Hong Kong SAR, China
Correspondence: Dr ES Lo, Department of Radiology, Princess Margaret Hospital, Hong Kong SAR, China. Email: les474@ha.org.hk
Submitted: 9 July 2025; Accepted: 29 September 2025.
Contributors: ESL, SCW and LFC designed the study. All authors acquired and analysed the data. ESL and SKHW drafted the manuscript.
All authors critically revised the manuscript for important intellectual content. All authors had full access to the data, contributed to the study,
approved the final version for publication, and take responsibility for its accuracy and integrity.
Conflicts of Interest: All authors have disclosed no conflicts of interest.
Funding/Support: This study received no specific grant from any funding agency in the public, commercial, or not-for-profit sectors.
Data Availability: All data generated or analysed during the present study are available from the corresponding author on reasonable request.
Ethics Approval: This study was approved by the Central Institutional Review Board of Hospital Authority, Hong Kong (Ref No.: CIRB-
2024-555-4). The patient was treated in accordance with the Declaration of Helsinki and provided written informed consent for all treatments,
procedures, and the publication of all clinical images.
Declaration: Part of this study was presented as a poster at the 18th Annual Scientific Meeting of Asia Pacific Society of Cardiovascular and Interventional Radiology, 3-5 May 2024, Bangkok, Thailand.
Supplementary Material: The supplementary material was provided by the authors and some information may not have been peer reviewed. Any opinions or recommendations discussed are solely those of the author(s) and are not endorsed by the Hong Kong College of Radiologists. The
Hong Kong College of Radiologists disclaims all liability and responsibility arising from any reliance placed on the content.
CASE PRESENTATION
A 59-year-old male patient with a history of smoking,
metabolic syndrome, ischaemic heart disease, and long-standing
peripheral arterial disease presented to our
institution in October 2022 with recurrent claudication.
He had previously undergone multiple lower limb
angioplasties and stenting procedures at various
institutions between 2018 and 2021 for recurrent in-stent
restenosis. These included an EverFlex stent (Medtronic,
Plymouth [MN], US) in the left external iliac
artery (EIA), a Protégé stent (Medtronic, Plymouth [MN],
US) in the left common iliac artery (CIA), an
EverFlex stent in the right EIA, a Supera stent (Abbott, Santa
Clara [CA], US) from the right common femoral
artery to the proximal superficial femoral artery (CFA-pSFA),
a Zilver stent (Cook Medical, Limerick, Ireland) in the right mid superficial femoral artery (mid-SFA), and
a Supera stent from the right distal superficial femoral
artery to the popliteal artery (dSFA-pop) [Figure 1].
Figure 1. A summary of stents previously placed in the patient
between 2018 and 2021 at various institutions. Left common iliac
artery (LCIA), left external iliac artery (LEIA), right external iliac
artery (REIA), and mid superficial femoral artery (mid-SFA) stents
were placed in 2018 for peripheral vascular disease. A distal
superficial femoral artery–popliteal artery (dSFA-pop) stent was placed
in early 2021. A common femoral artery to proximal superficial
femoral artery (CFA-pSFA) stent was placed in November 2021
to bridge the REIA and mid-SFA stents. A thin white line depicts
the course of the retrograde guidewire during the 2023 SAFARI
(subintimal arterial flossing with antegrade-retrograde intervention)
double-barrel stenting procedure. The intraluminal position within
the dSFA-pop stent, subintimal position outside the lumen of
the mid-SFA stent, and subsequent intraluminal re-entry into the
CFA-pSFA stent were confirmed by fluoroscopy and intravascular
ultrasound. The retrograde wire was subsequently advanced into
a long sheath to establish a floss wire between the right ankle and
left groin access.
The patient presented in 2022 with recurrent claudication
following placement of a bridging CFA-pSFA stent
between the right EIA and mid-SFA stents, with
claudication distance reduced to 10 metres. In view of
his recurrent symptoms, the authors were consulted
for suspected stent occlusion of the previously placed
multi-stent system. Computed tomography angiography
revealed an in-stent occlusion due to misalignment of
the CFA-pSFA and mid-SFA stents (Figure 2), likely
resulting from subintimal placement of the CFA-pSFA
stent.
Figure 2. Computed tomography
angiogram in 2022 showing stent
occlusion, likely resulting from
malalignment of the common
femoral artery to the Supera stent
(blue arrows) of the proximal
superficial femoral artery (CFA-pSFA)
and the Zilver stent (black
arrows) of the mid superficial
femoral artery (mid-SFA). The
distal margin of the CFA-pSFA
stent is seen within the subintimal
space, external to the mid-SFA
stent. (a) Axial view. (b) Sagittal
reconstruction.

Digital subtraction angiography images in the
anteroposterior projection from the previous procedure
in November 2021 revealed apparent alignment of
the CFA-pSFA and mid-SFA stents, with improved
runoff post-stenting (Figure 3). Lateral views were unavailable. In view of the recurrent claudication and
the in-stent occlusion, repeat angioplasty was performed
in October 2023. Left CFA access with crossover was
performed. A 6-Fr Destination long sheath (Terumo, Somerset [NJ], US) was placed in the right CIA. A 0.035-inch guidewire (Terumo, Tokyo, Japan) was
advanced through the lumen of the occluded right
CFA-pSFA stent, encountering resistance (Figure 4a).
Inability to negotiate the wire into the right mid-SFA
stent led to a decision to obtain retrograde access via
the right posterior tibial artery (PTA). With the aid of
a 2.6-Fr CXI microcatheter (Cook Medical, Bloomington [IN], US), a 0.018-inch Advantage wire (Terumo, Tokyo, Japan) was advanced retrogradely through the PTA
and the dSFA-pop Supera stent intraluminally. The wire
was manipulated at the junction of the mid-SFA Zilver
stent and dSFA-pop Supera stent, entering the subintimal
space. After further subintimal manipulation, re-entry
of the retrograde wire into the lumen of the occluded
CFA-pSFA stent was achieved. The wire was then
advanced into the right EIA/CIA stent lumen (Figures 1 and 4b). Wire position was confirmed by intravascular
ultrasound (IVUS) [Visions PV 0.018-inch catheter
(Phillips, Rancho Cordova [CA], US)] and angiography.
The retrograde wire was externalised through the 6-Fr
crossover sheath and retrieved via the left groin access to
establish through-and-through access.
Figure 3. Retrospective review of prior common femoral artery
to proximal superficial femoral artery bridging stent placement
in 2021 showing (a) apparent stent alignment (black arrow) and
(b) acceptable runoff on completion angiography.
Figure 4. Digital subtraction angiography images of angioplasty and double-barrel stenting performed in November 2023. (a) Crossover
wire from left femoral access, with the tip positioned within the right common femoral artery to the proximal superficial femoral artery (CFA-pSFA)
stent, encountering resistance due to occlusion. The occlusion was eventually navigated; however, in view of failure to re-enter the
mid superficial femoral artery (mid-SFA) stent lumen, a retrograde approach was employed. (b) A 0.018-inch retrograde wire via right posterior
tibial artery access was advanced intraluminally through the occluded distal superficial femoral artery popliteal artery stent, with subsequent
entry into the subintimal space outside the Zilver SFA stent and re-entry into the intraluminal occluded CFA stent. The long sheath from
the left groin access was cannulated by the retrograde wire and subsequently externalised, establishing a through-and-through floss wire.
Position was confirmed by intravascular ultrasound (Figure 6). (c) After establishment of the floss wire, angioplasty of the intraluminal-subintimal-intraluminal wire tract was performed. (d, e) Angioplasty of the posterior tibial artery and tibioperoneal trunk was performed,
followed by mid-SFA stenting with double-barrel exclusion of the Zilver stent. Completion angiography showed significant restoration of
flow between the newly deployed mid-SFA stent and adjacent stents.

Angioplasty was performed along the wire path from the
right popliteal artery stent to the left EIA stent with an Armada 6 × 200 mm2 balloon (Abbott, Santa Clara [CA], US),
expanding the subintimal space for subsequent stenting.
Following IVUS sizing, double-barrel subintimal
stenting was performed by deploying a Supera 5.5 × 80 mm2 stent to bridge the CFA-pSFA and dSFA-pop
stents (Figure 4c). Additional angioplasty of the newly
deployed stent, as well as the PTA and tibioperoneal trunk,
was performed with an Armada 2.5 × 200 mm2 balloon.
Completion angiography demonstrated re-establishment
of flow through the double-barrel subintimal stent, with a
patent intraluminal-subintimal-intraluminal channel and
crush exclusion of the Zilver mid-SFA stent (Figure 4d and e). Postoperatively, the patient resumed apixaban 5 mg twice daily and aspirin 80 mg daily.
At 1-month follow-up, symptoms improved from
claudication after walking 20 steps (Rutherford grade
III) to no claudication (Rutherford grade 0). There was
no evidence of tissue loss or vascular compromise. At
8 months, follow-up computed tomography showed
successful crush exclusion of the mid-SFA Zilver stent (Figure 5). There was complete alignment of the mid-SFA Supera stent with adjacent proximal and distal stents, with preserved patency and no significant in-stent restenosis (Figure 5). However, mild-to-moderate instent
restenosis was noted in the previously implanted
popliteal and iliac stents. The patient remains under
surveillance and is scheduled for repeat angioplasty
to preserve the patency of the multi-stent system
(online supplementary Figure).
Figure 5. Follow-up computed
tomography angiogram at 8 months postprocedure showing successful double-barrel stenting with exclusion of the mid superficial femoral artery (mid-SFA) Zilver stent (black arrows in [a] and [c]) and a patent new Supera mid-SFA stent (blue arrows in [a] and [c]): (a) axial view; (c) oblique sagittal view. Oblique coronal reconstruction showing patency throughout the intraluminal-subintimal-intraluminal multi-stent
system (b), including the distal overlapping stent segments (black arrowhead in [d]) and the proximal overlapping stent segments (blue arrowhead in [e]).
DISCUSSION
Our case highlights several important considerations for
interventionists. In retrospect, inadvertent subintimal
stent placement could have been avoided through several
measures. First, routine biplanar imaging could prevent
false assurance from a single anteroposterior projection
and detect stent misalignment. Attention should also
be paid to contrast pooling around the stent tips and
the rate of contrast runoff; delayed clearance may alert
the operator to possible distal outflow impairment
or subintimal entry. Second, careful observation of
the guidewire tip behaviour and mobility may alert
interventionists to inadvertent subintimal entry. In
cases of initial intimal dissection and subintimal entry,
the tip load of the guidewire may be exceeded with
the wire tip bending in the reverse direction and a
‘crushing’ sensation commonly reported.[1] Initial entry
into the potential subintimal space may restrict free wire
rotation. Nonetheless, where manipulation continues
and the wire tracks further into an enlarging subintimal
space, guidewire rotation may become freer, with loss
of resistance. Prolonged manipulation should be avoided
if early intraluminal re-entry fails, as this may enlarge
the subintimal space and further complicate luminal
re-entry. Third, in cases of equivocal wire position,
familiarity with IVUS may assist operators in accurately stenting within the true lumen. The IVUS images from
our salvage procedure are shown (Figure 6). Although
resource-intensive and operator-dependent, IVUS
enables more accurate visualisation of the vascular and
subintimal spaces with applications not only in stent
positioning but also in the accurate arterial stent sizing.[2] [3]
Figure 6. Intravascular
ultrasound (IVUS) images
confirming wire positioning from
the 2023 SAFARI (subintimal
arterial flossing with antegrade-retrograde
intervention) double-barrel
stenting procedure. (a)
IVUS enables vessel sizing
for selection of appropriate
catheters and stents. (b) IVUS
image showing the echogenic
guidewire in the intraluminal
space (arrow). (c) IVUS image
showing echogenic guidewire
in the subintimal space (arrow).
(d) IVUS allows assessment
of stent margins to prevent
malalignment and inadvertent
subintimal entry.
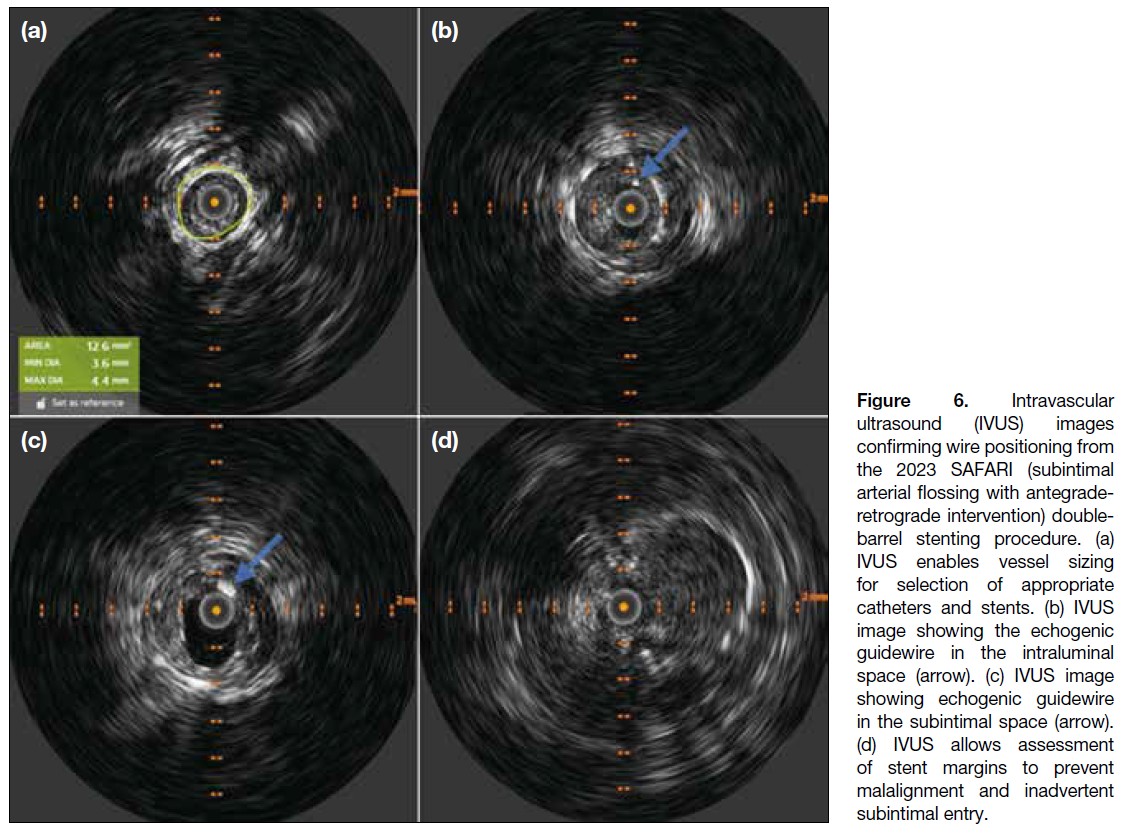
In cases of inadvertent subintimal entry or dissection,
achieving luminal re-entry remains a major challenge,
and familiarity with re-entry techniques is essential
for interventionists. If spontaneous re-entry cannot be
achieved with a standard wire, specific re-entry devices
such as the Outback (Cordis, Miami Lakes [FL], US)
may be utilised. Promising data demonstrated technical
success and primary stent patency rates of up to 92.3% at
12 months with the Outback, as subintimal angioplasty
gains increasing recognition in the treatment of long-segment
TransAtlantic Inter-Society Consensus II class
C/D lesions.[4] Where such devices are unavailable,
several alternative approaches may be considered,
including retrograde access via the distal artery with
establishment of a through-and-through floss wire using the subintimal arterial flossing with antegrade-retrograde
intervention (the SAFARI [subintimal arterial flossing
with antegrade-retrograde intervention] technique[5]
as in our case), the parallel wire technique,[6] the wire
rendezvous technique with ballooning of subintimal
space as seen in CART (controlled antegrade and
retrograde subintimal tracking), reverse CART, or the
double-balloon technique.[7] [8]
In our experience, SAFARI can be performed in several
ways once luminal re-entry has been achieved. First,
a nitinol snare system may be deployed via antegrade
access to capture the retrograde wire intraluminally and
establish a through-and-through access.[9] Alternatively,
retrograde manipulation of the wire tip within the sheath
or catheter via groin access may be performed (as in our
current case).
To the best of our knowledge, cases of double-barrel
subintimal stenting are sparsely reported in the literature
and have not been reported locally. Several case reports
describe double-barrel stenting (DBS) for exclusion of occluded stents in salvage procedures for lower limb and
coronary arterial occlusions,[10] [11] [12] although this remains
an uncommonly utilised technique. One case series of
three patients with peripheral arterial disease following
DBS reported varying degrees of success, with the
longest assisted secondary patency of up to 85 months,[13]
supporting its feasibility and long-term patency.
CONCLUSION
We report a case of prior inadvertent subintimal stenting
of a bridging CFA-pSFA stent, followed by successful
salvage with subintimal DBS using the SAFARI
technique within a multi-stent system. Methods to reduce
the risk of inadvertent subintimal stenting are discussed.
Subintimal manipulation and re-entry techniques with
antegrade-retrograde approaches are also discussed as important tools for interventionists. Although not
commonly employed, DBS has been described in several
case reports and small case series. Our case affirms the
feasibility of this technique where salvage of inadvertent
subintimal stenting is necessary.
REFERENCES
1. Dash D. Guidewire crossing techniques in coronary chronic total occlusion intervention: A to Z. Indian Heart J. 2016;68:410–20.
Crossref
2. Loffroy R, Falvo N, Galland C, Fréchier L, Ledan F, Midulla M, et al. Intravascular ultrasound in the endovascular treatment of patients with peripheral arterial disease: current role and future perspectives. Front Cardiovasc Med. 2020;7:551861.
Crossref
3. Ying LH, Fan YS, Lu Y, Xu K, Li CJ. Intravascular ultrasound guided retrograde guidewire true lumen tracking technique for chronic total occlusion intervention. J Geriatr Cardiol. 2018;15:199–202.
Crossref
4. Gandini R, Fabiano S, Spano S, Volpi T, Morosetti D, Chiaravalloti A, et al. Randomized control study of the Outback LTD reentry catheter versus manual reentry for the treatment of chronic total occlusions in the superficial femoral artery. Catheter Cardiovasc Interv. 2013;82:485–92.
Crossref
5. Zhuang KD, Tan SG, Tay KH. The “SAFARI” technique using retrograde access via peroneal artery access. Cardiovasc Intervent Radiol. 2012;35:927–31.
Crossref
6. Taniguchi Y, Sakakura K, Ban S, Fujita H. IVUS-assisted parallel wiring for coronary chronic total occlusion. Postępy Kardiol Interwencyjnej. 2022;18:79–80.
Crossref
7. Michael TT, Papayannis AC, Banerjee S, Brilakis ES. Subintimal dissection/reentry strategies in coronary chronic total occlusion interventions. Circ Cardiovasc Interv. 2012;5:729–38.
Crossref
8. Lee CH, Lee SW. Advancements in endovascular therapy for chronic limb-threatening ischemia: a focus on below-the-ankle interventions and wound healing strategies. J Cardiovasc Interv. 2023;2:220–31.
Crossref
9. Spinosa DJ, Harthun NL, Bissonette EA, Cage D, Leung DA, Angle JF, et al. Subintimal arterial flossing with antegrade-retrograde intervention (SAFARI) for subintimal recanalization to treat chronic critical limb ischemia. J Vasc Interv Radiol. 2005;16:37–44.
Crossref
10. Duterloo D, Lohle PN, Lampmann LE. Subintimal double-barrel restenting of an occluded primary stented superficial femoral artery. Cardiovasc Intervent Radiol. 2007;30:474–6.
Crossref
11. Somsen YB, Nap A, Henriques JP, Knaapen P. Double barrel in CTO PCI. PCRonline.com. Available from: https://www.pcronline.com/Cases-resources-images/Images-interventional-cardiology/EuroIntervention-images/2024/Double-barrel-in-CTO-PCI. Accessed 1 Jun 2025.
12. Capretti G, Mitomo S, Giglio M, Carlino M, Colombo A, Azzalini L. Subintimal crush of an occluded stent to recanalize a chronic total occlusion due to in-stent restenosis: insights from a multimodality imaging approach. JACC Cardiovasc Interv. 2017;10:e81–3.
Crossref
13. Asfoura S, Farooq I, Siddiqui W, Khatib Y. Long-term patency of double-barrel endovascular stenting for occlusive peripheral vascular disease. Available from: https://javelinjournal.org/long-term-patency-of-double-barrel-endovascular-stenting-for-occlusive-peripheral-vascular-disease/. Accessed 1 Jun 2025.
PICTORIAL ESSAY
Revisiting Preoperative Evaluation of the Inferior Vena Cava in Abdominal Malignancies: A Pictorial Essay
PICTORIAL ESSAY
Hong Kong J Radiol 2026 Mar;29(1):e44-57 | Epub 6 March 2026
Revisiting Preoperative Evaluation of the Inferior Vena Cava in Abdominal Malignancies: A Pictorial Essay
A Mandava1, V Koppula1, M Kandati1, AK Reddy1, H Kacharagadla1, SR Thammineedi2
1 Department of Radiodiagnosis, Basavatarakam Indo American Cancer Hospital and Research Institute,
Hyderabad, India
2 Department of Surgical Oncology, Basavatarakam Indo American Cancer Hospital and Research Institute,
Hyderabad, India
Correspondence: Dr A Mandava, Department of Radiodiagnosis, Basavatarakam Indo American Cancer Hospital and Research
Institute, Hyderabad, India. Email: dranitha@basavatarakam.org
Submitted: 6 August 2025; Accepted: 23 November 2025.
Contributors: All authors designed the study, acquired the data, analysed the data, drafted the manuscript, and critically revised the manuscript
for important intellectual content. All authors had full access to the data, contributed to the study, approved the final version for publication, and
take responsibility for its accuracy and integrity.
Conflicts of Interest: All authors have disclosed no conflicts of interest.
Funding/Support: This study received no specific grant from any funding agency in the public, commercial, or not-for-profit sectors.
Data Availability: All data generated or analysed during the present study are available from the corresponding author on reasonable request.
Ethics Approval: The study was approved by the Institutional Ethics Committee of Basavatarakam Indo American Cancer Hospital and Research
Institute, India (Ref No.: IEC/2021/55). A waiver of informed patient consent was granted by the Committee as the study involved minimal risk
and non-identifiable data were used.
Declaration: A few of the images were presented as part of scientific exhibit in Radiological Society of North America Annual Meeting 2023, 26-30 November 2023,
Chicago [IL], United States.
INTRODUCTION
Inferior vena cava (IVC) is the largest vein in the
body, draining blood from the lower extremities,
pelvis, and abdomen into the right atrium. Accurate
anatomical assessment is crucial when planning
vascular interventions, resections, anastomoses,
and reconstructions that form an integral part of the
surgical management of abdominopelvic malignancies.
Anomalies and variants can complicate access to the IVC
and its tributaries during interventional procedures and
filter placement. Given that abdominopelvic oncological
surgeries require extensive dissections, unawareness
of vascular involvement and congenital anomalies
can lead to inadvertent injuries with catastrophic
outcomes. Contrast-enhanced computed tomography
with reconstruction is the gold-standard non-invasive
investigation for presurgical mapping; ultrasound with colour Doppler, magnetic resonance imaging, and
positron emission tomography/computed tomography
often play complementary roles in evaluating the IVC
and its draining veins. This pictorial essay presents
several illustrative cases from our experience at a tertiary
care cancer centre in India.
ANATOMY AND VARIANTS
The embryogenesis and development of the IVC is a
complex process, and multiple congenital variations
can arise from abnormal persistence or regression of
embryological veins (Table 1).[1] [2] [3] [4] [5] [6] [7] [8] These congenital
anomalies are collectively present in 4% of the
population.[2] [3] [4] [5] [6] [7] [8] The most common clinically significant
variations include duplication of the IVC and absence
or agenesis (interruption) of the IVC with prominent
hemiazygos-azygos pathways[2] (Figures 1, 2, 3, 4, and 5). Because visceral thoracic and abdominal organs demonstrate left-right
anatomical asymmetry, awareness of discrepancies
in laterality and venous drainage into the IVC—such
as in situs inversus and heterotaxy syndromes—is
critical before undertaking biliary, hepatic, and gastric
surgeries (Figure 6). Variations in renal vein anatomy
are often asymptomatic and overlooked but are crucial
during renal or adrenal surgeries and retroperitoneal dissections. Anomalous veins and collateral vessels may
be misdiagnosed as lymphadenopathy; hence, contrast
imaging is essential in all cases of malignancy (Figures 7, 8, and 9).
Table 1. Common congenital anomalies involving the inferior vena cava and their incidence.[1] [2] [3] [4] [5] [6] [7] [8]
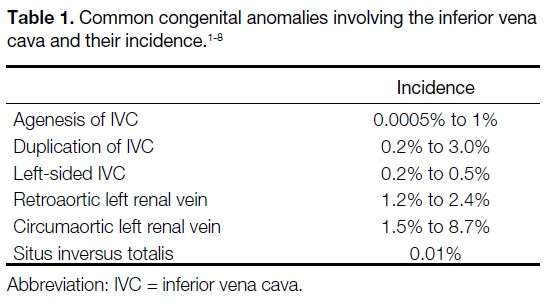
Figure 1. Volume-rendered contrast-enhanced computed tomography images. (a) Interrupted inferior vena cava (IVC) with absence of the
infrahepatic IVC. The suprahepatic IVC (white arrow) drains into the right atrium (RA) of the heart. The normal portal vein (PV) and the aorta
(A) are visible. (b) Rare case of complete duplication of the superior vena cava in the thorax (orange arrows) and the IVC in the abdomen
(white arrows), with multiple bridging veins between duplicated segments (blue arrows). (c) The IVC (white arrow) lies to the left of the aorta
(A), with dextrocardia in a patient with situs inversus totalis.
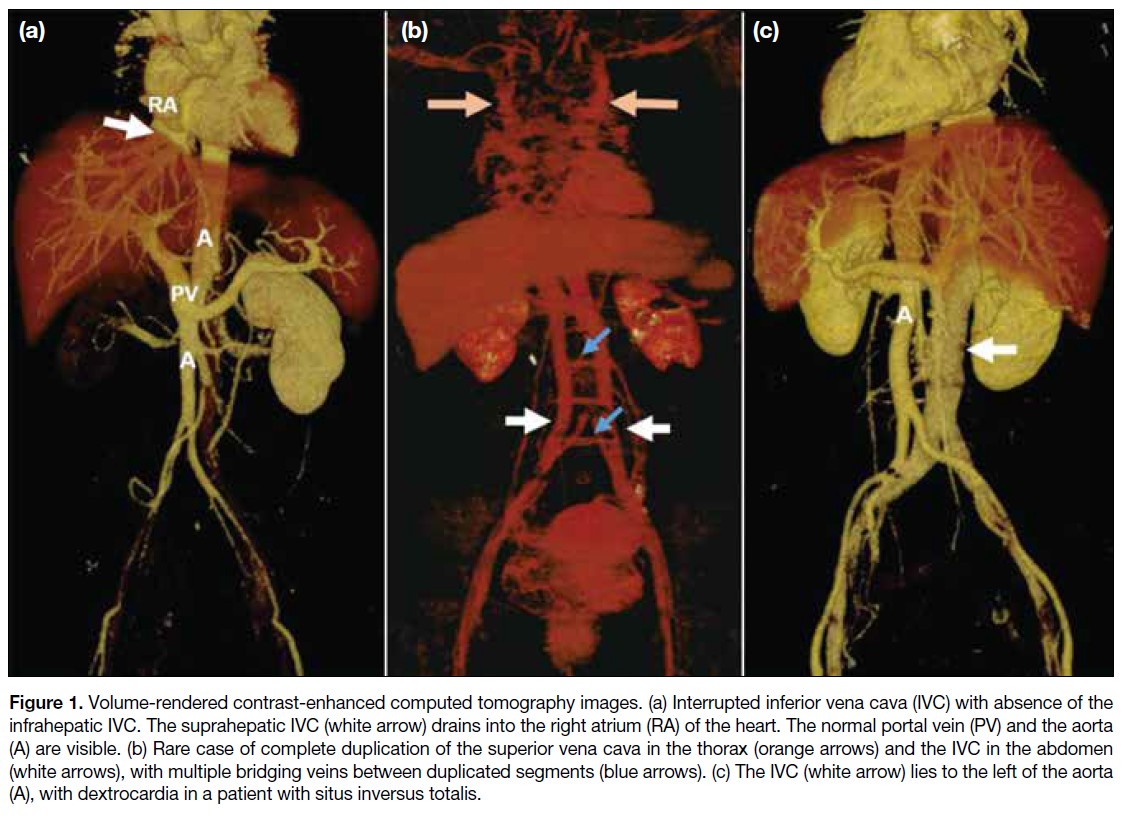
Figure 2. (a) Anterior and (b)
posterior volume-rendered contrast-enhanced
computed tomography
images show a left inferior vena
cava with hemiazygos continuation,
crossing the midline posterior to
the aorta (A) and draining into the
azygos-superior vena cava pathway
(white arrows). Hepatic veins are
visible draining separately into the
right atrium (green arrows).
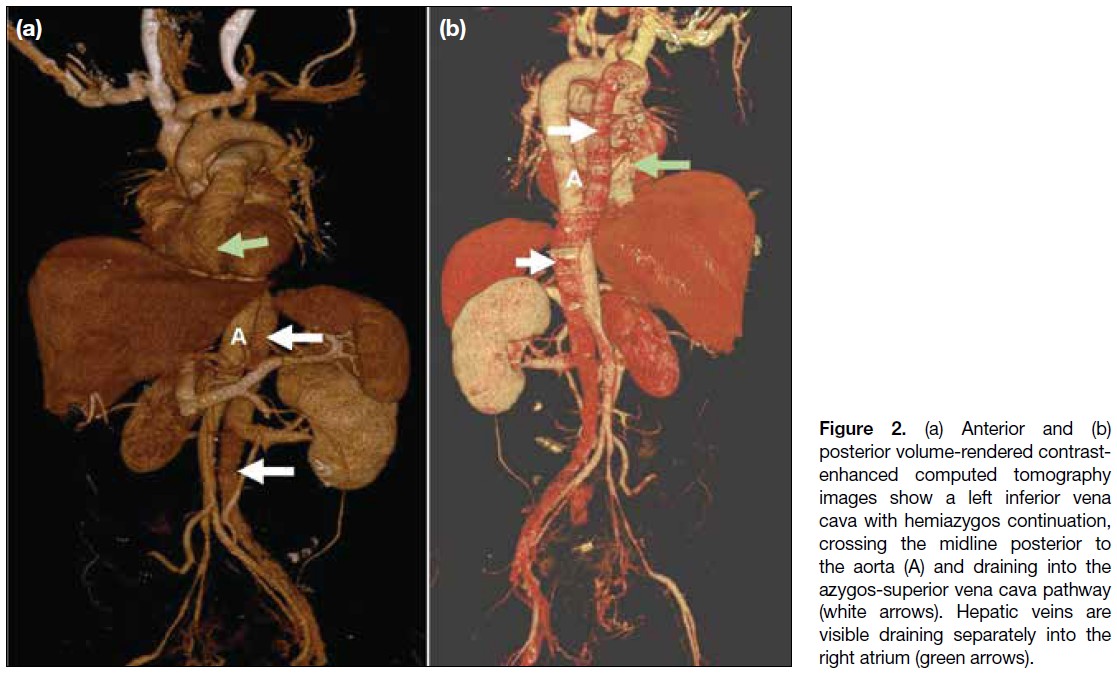
Figure 3. Coronal maximum intensity projection contrast-enhanced computed tomography images of the abdomen. (a) Normal inferior vena
cava (IVC) [white arrow] to the right of the aorta (A), formed by the confluence of the bilateral common iliac veins (red arrows), draining into
the right atrium (RA). (b) Duplication of the IVC (white arrows) in a patient with gastric malignancy (star). The left infrarenal IVC crosses the
midline anterior to the aorta (A) and joins the right IVC. (c) Duplication of the IVC (white arrows) on both sides of the aorta (A) in a patient with
endometrial malignancy (star) and a complex right ovarian cyst (yellow arrow).
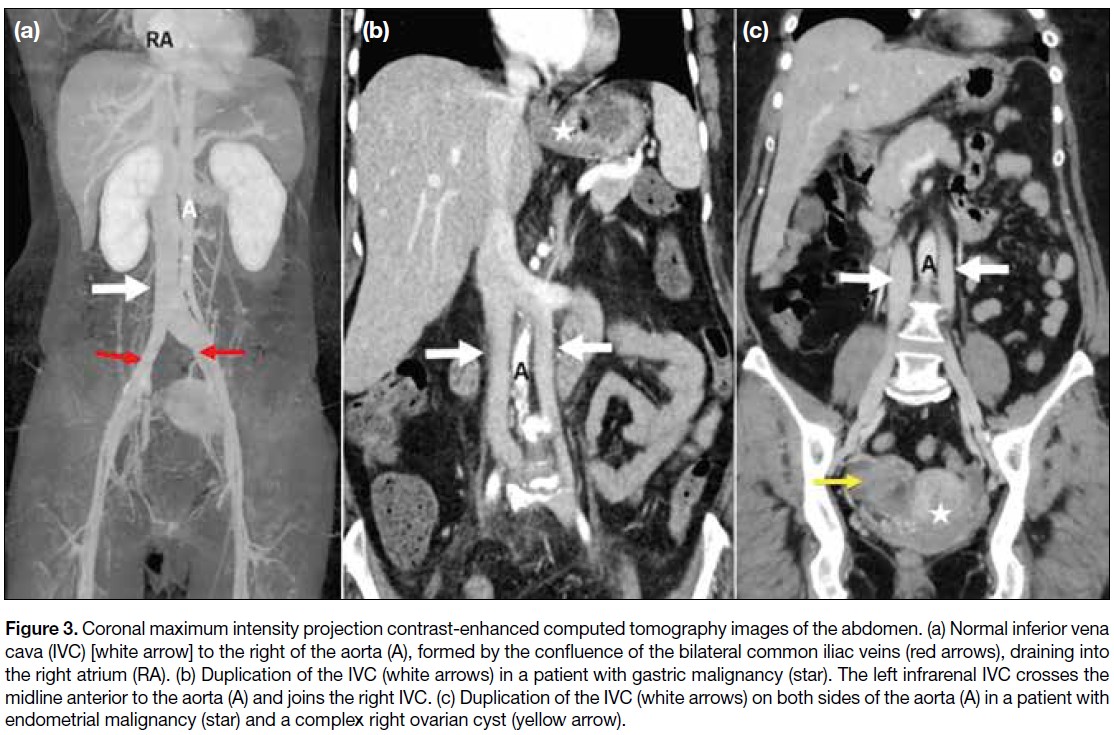
Figure 4. Coronal (a) and
axial (b, c) contrast-enhanced
computed tomography
images in a patient with
gastric malignancy (star in [a])
show polysplenia (S) and a
right inferior vena cava with
azygos continuation (white
arrows) draining into the
superior vena cava (curved
arrow in [a]). Hepatic veins
drain separately into the
right atrium (black arrow
in [b]), and para-aortic
lymphadenopathy is also
noted (red arrows in [c]).
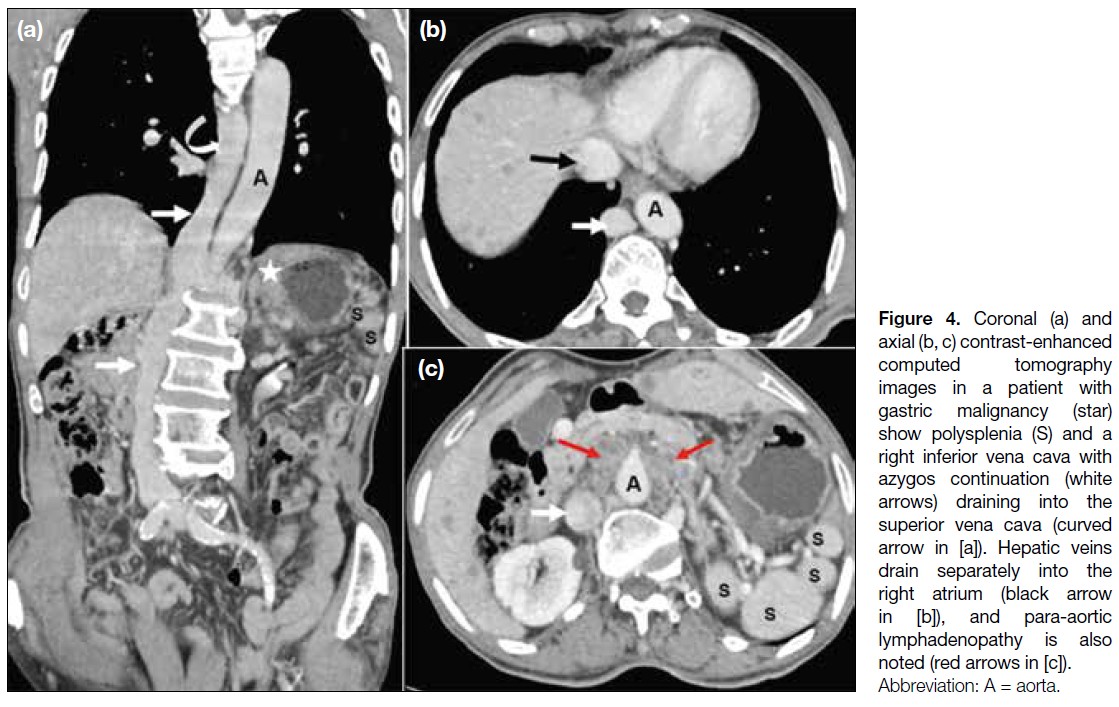
Figure 5. (a) Coronal
contrast-enhanced computed tomography
and (b) posterior maximum
intensity projection images
of a patient with cervical
carcinoma and pyometra
(star in [a]) show a left
inferior vena cava crossing
the midline posterior to the
aorta (A), continuing as the
azygos-superior vena cava
pathway (yellow arrows).
Hepatic veins (black arrows)
drain separately into the right
atrium (RA).
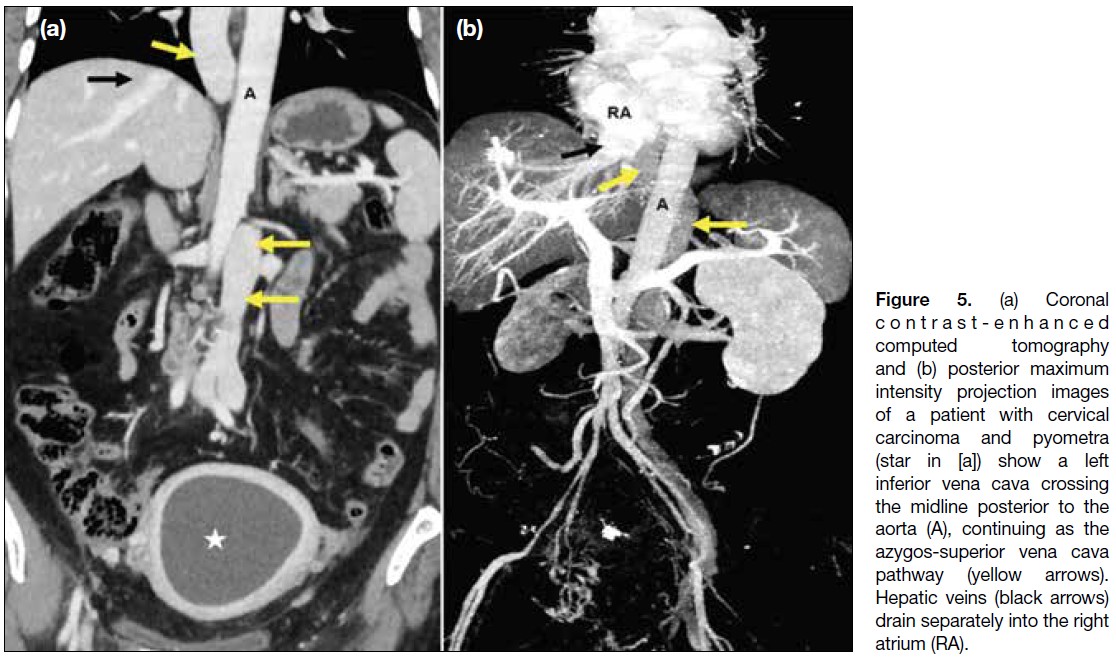
Figure 6. Two cases of situs
inversus totalis. (a) A 48-year-old
woman with bilateral
ovarian malignancy (stars). The
right ovarian vein (red arrows)
crosses the midline posterior to
the aorta (A) and drains into the
inferior vena cava (IVC) [yellow
arrow], while a prominent left
ovarian vein drains directly into
the left-sided IVC (blue elbow
arrow). (b) A 55-year-old man
with hepatocellular carcinoma
(star). The IVC (yellow arrow)
lies to the left of the aorta (A),
with an intraluminal thrombus
present in the hepatic and
suprahepatic segments (black arrow).
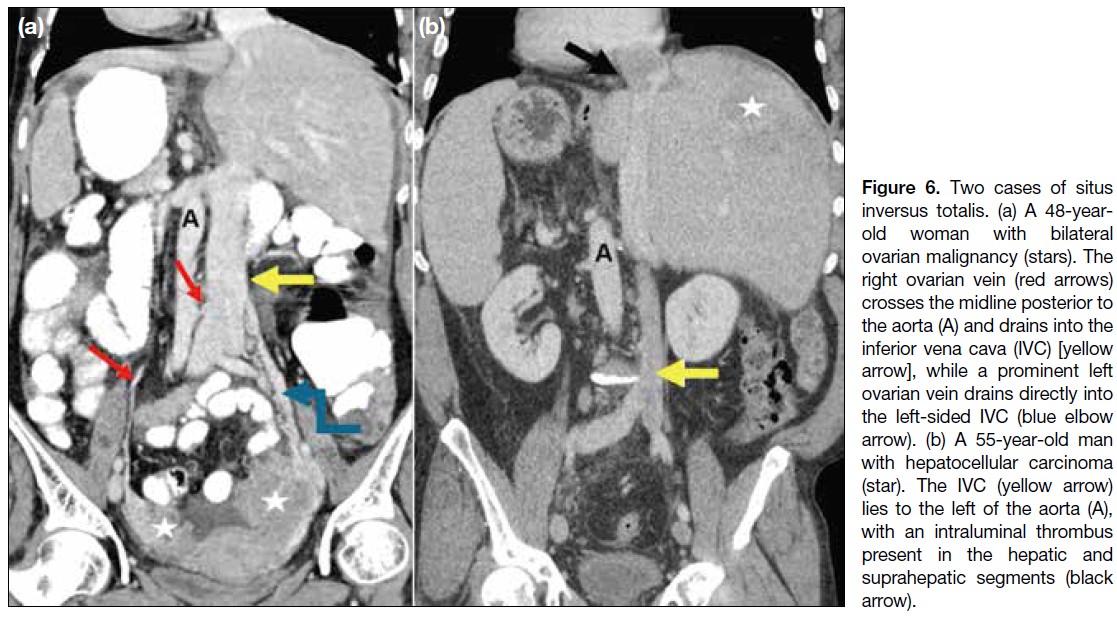
Figure 7. (a) Axial and (b, c) coronal contrast-enhanced computed tomography images of a patient with left renal cell carcinoma (stars) show
a duplicated inferior vena cava (IVC) on either side of the aorta (A), with azygos continuation of the right IVC (red arrows). The left IVC (white
arrows) crosses the midline and drains into the right IVC-azygos-superior vena cava pathway (green curved arrow in [b]). Tumour thrombus
is present in the left renal vein and the left IVC, extending across the midline into the azygos continuation of the right IVC (black arrows).
Hepatic veins drain separately into the right atrium (yellow elbow arrow in [c]).
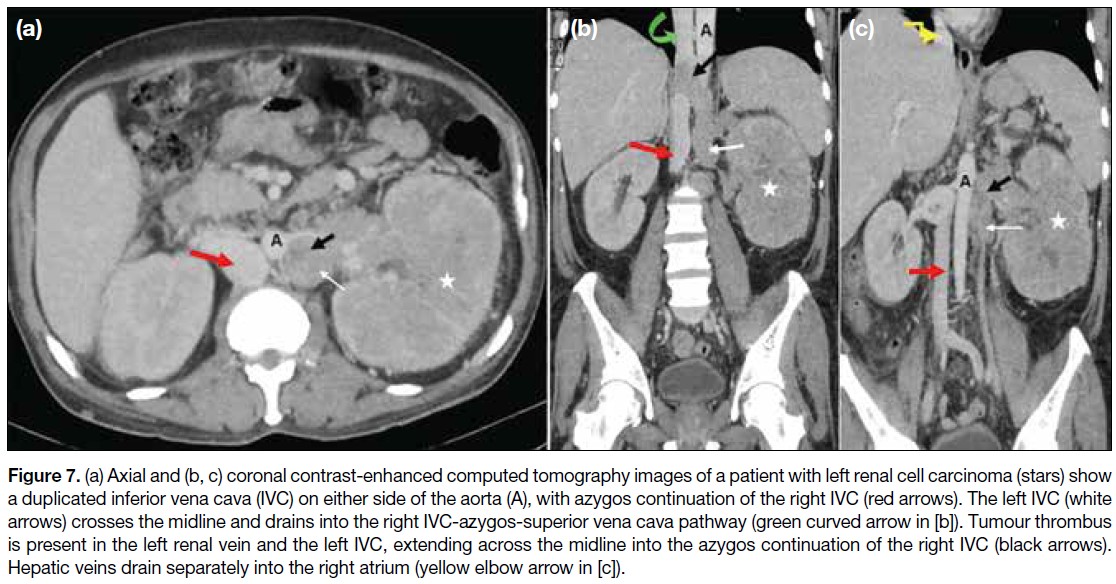
Figure 8. Contiguous axial contrast-enhanced computed tomography images showing anomalous renal veins. (a) Retroaortic left renal vein
(red arrow) posterior to the aorta, draining into the normal right inferior vena cava (IVC) [white arrow] in a patient with abdominal liposarcoma (star). (b) Retroaortic right renal vein (red arrow) draining into the left IVC (white arrow). (c) Circumaortic left renal veins (red arrows) passing anterior and posterior to the aorta, draining into the right-sided IVC (white arrows).
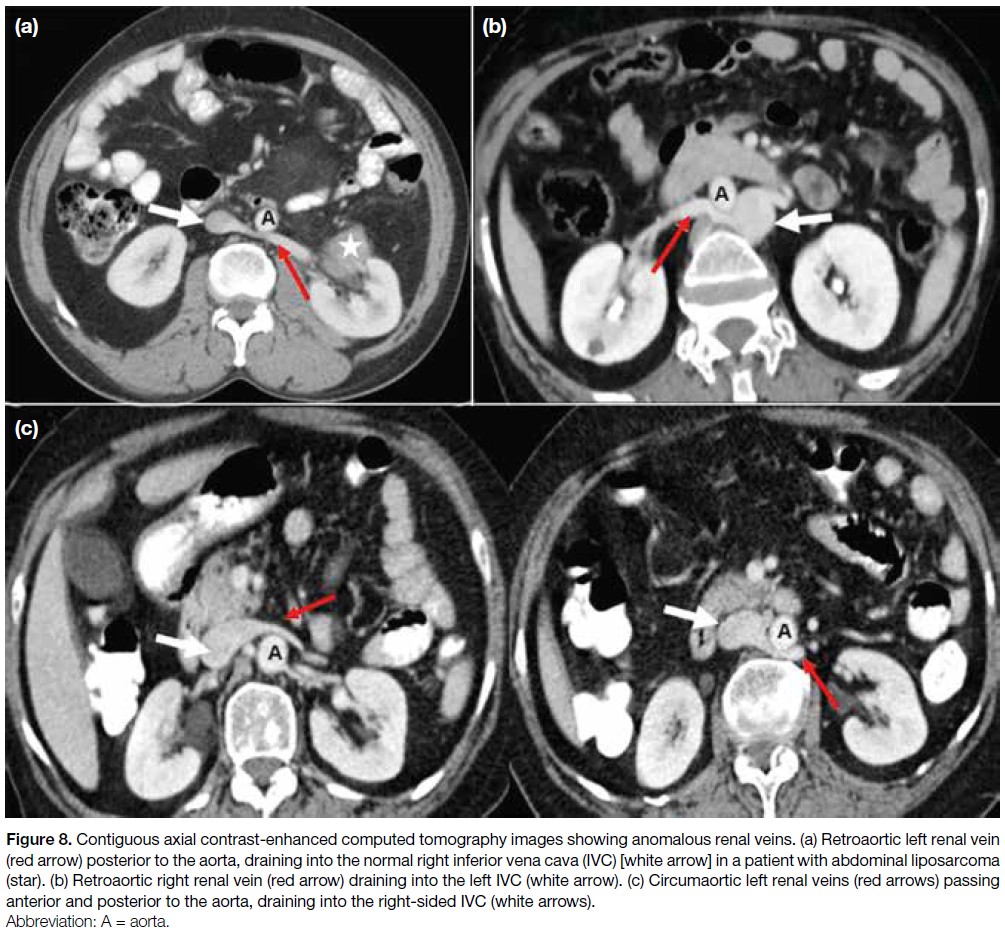
Figure 9. (a) Tortuous left renal vein draining into the left common iliac vein (white arrow) instead of the inferior vena cava (IVC) [black arrow].
(b) Anterior and (c) posterior views show ‘horseshoe’ kidneys (K) with vertically oriented renal veins (white arrows in [b]) and gonadal veins
(red arrows in [c]) draining into the IVC (black arrow in [b]) in a patient with endometrial malignancy (stars).

ACQUIRED PATHOLOGIES
The major acquired venous pathologies in abdominopelvic
malignancies include external compression or infiltration
of the IVC and its draining veins by neoplasms (Figures 10 and 11), metastatic lymph nodes (Figure 12), and/or
intraluminal thrombosis.
Figure 10. Right adrenocortical malignancy. (a) Axial and (b) coronal contrast-enhanced computed tomography images of the abdomen
show a large, heterogeneously enhancing hypoattenuating lesion (stars) invading the inferior vena cava (arrows).
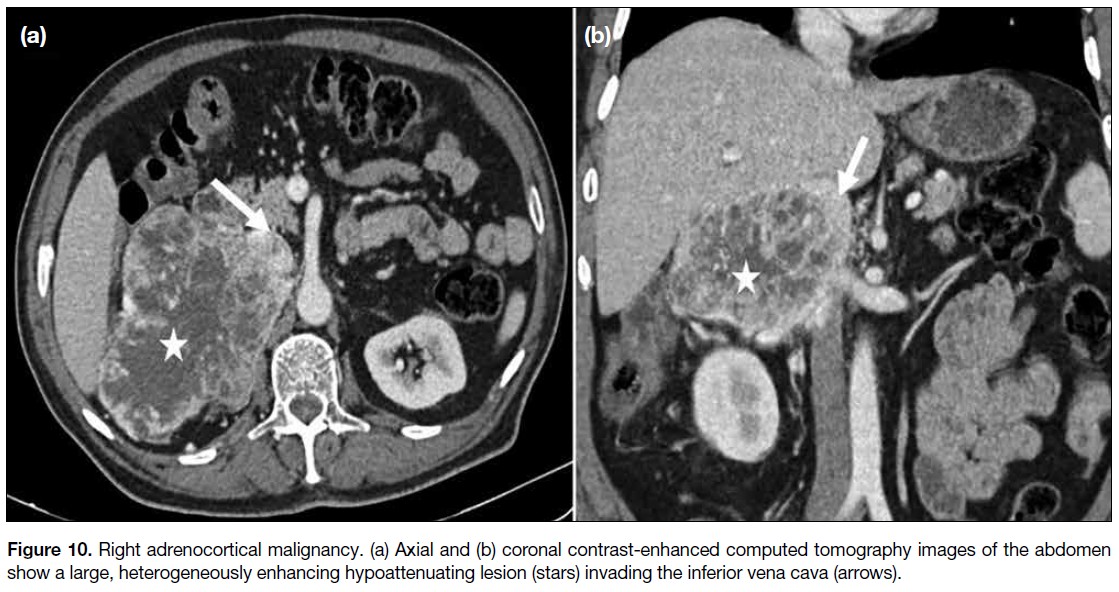
Figure 11. Retroperitoneal
liposarcoma. (a) Axial and (b)
coronal contrast-enhanced
computed tomography images of the abdomen show large fatty component (stars) and small soft-tissue component (red arrows) encasing the inferior vena cava (white arrows).
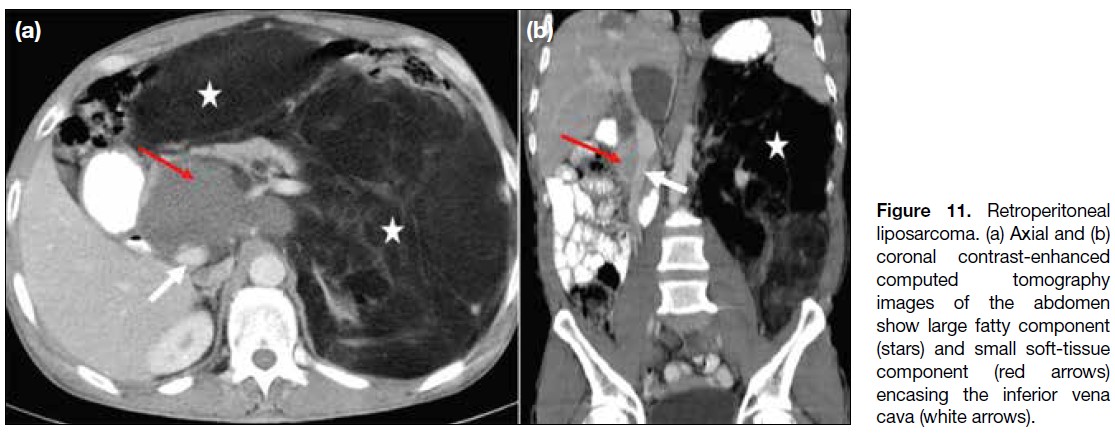
Figure 12. A 24-year-old
man with lymphoma.
(a) Axial and (b) coronal
contrast-enhanced
computed tomography
images of the abdomen
show splenomegaly (stars)
and conglomerated nodal
mass (red arrows) encasing
and causing narrowing
of the inferior vena cava
(IVC) [white arrows], aorta,
and their branches. (c,
d) Corresponding post-chemotherapy
images show
a significant decrease in the
size of the nodal mass (red
arrows) and spleen (star
in [d]), with expansion and
visualisation of the IVC (white
arrows).

Malignancies most commonly involving the IVC
include those of the liver (4.0%-5.9%), kidney (4%-10%), and adrenal glands (9%-19%).[4] [8] Although the
portal veins are more frequently involved, abnormalities
of the hepatic artery, hepatic veins, and IVC may occur
in hepatocellular carcinomas; accordingly, triphasic
computed tomography should be performed in the
evaluation of liver malignancies (Figure 13).
Figure 13. Hepatocellular carcinoma (HCC) in a 56-year-old man. (a) Axial and (b) coronal contrast-enhanced computed tomography
(CECT) images in the early arterial phase show contrast opacification of the aorta (A), hepatic artery, and portal vein due to an arterioportal
fistula in the right lobe of the liver (black arrows). (c) Axial CECT image shows HCC (star) with thrombus in the inferior vena cava (IVC) [black arrow]. (d, e) Coronal CECT images in the venous phase show HCC (stars), along with thrombus in the portal vein (red arrow in [d]) and
hepatic veins (black arrows) extending into the IVC (white arrows).
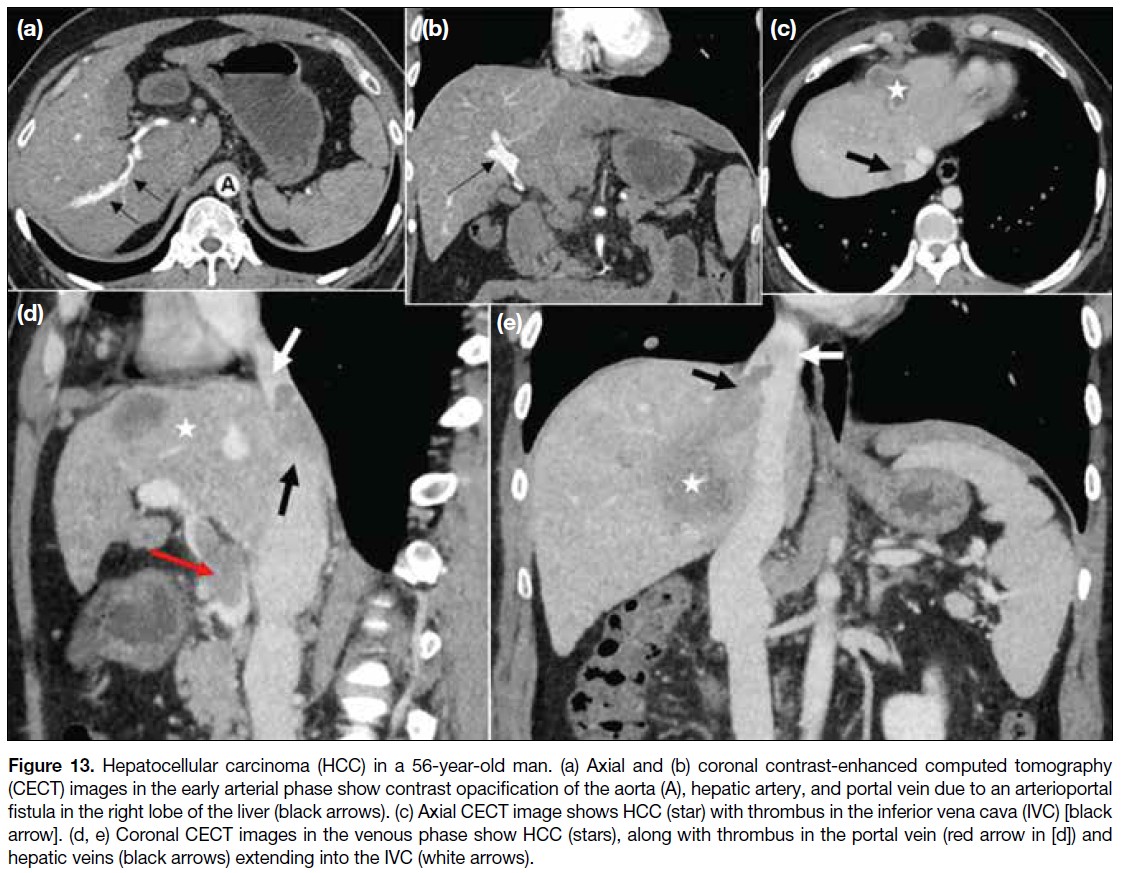
Cancer-associated thrombosis is recognised as the
most common complication of cancer and is attributed
to several factors (Table 2).[7] [8] [9] [10] [11] [12] Compared with the
general population, patients with cancer have a 12-fold increased risk of developing venous thrombosis, as well
as a significantly worse prognosis[9] [10] (Figure 14). The
IVC and its tributaries, especially the renal and gonadal
veins, should be assessed in all abdominal malignancies to exclude thrombosis (Figure 15). Postsurgical venous
thromboembolism is the leading cause of postoperative
death in cancer patients, and IVC thrombosis is associated
with substantial morbidity and mortality.[11] [12]
Table 2. Risk factors associated with increased incidence of thrombosis in patients with cancer. [7] [8] [9] [10] [11] [12]
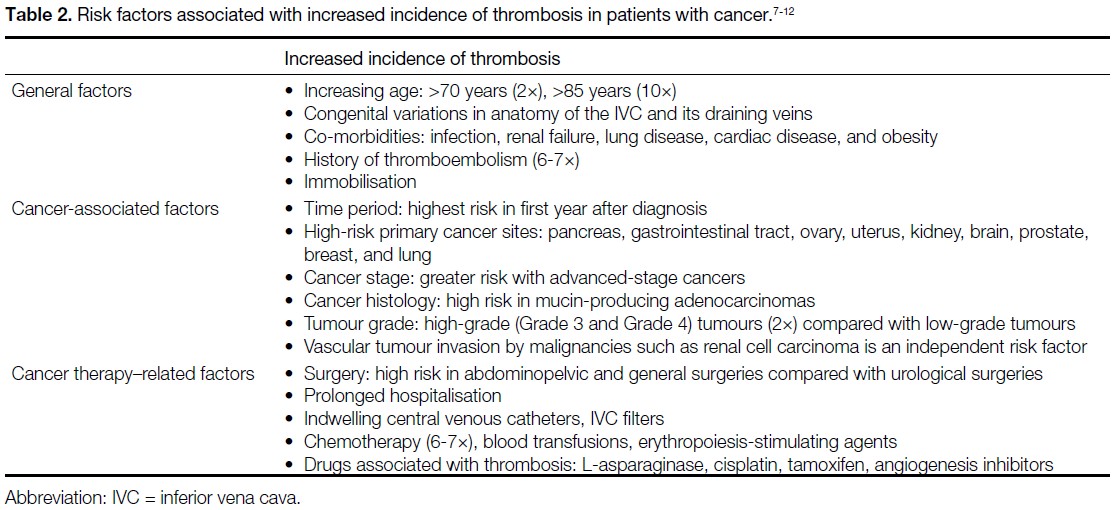
Figure 14. (a) Coronal contrast-enhanced computed tomography (CECT) image of a 56-year-old man with adenocarcinoma of the stomach
shows antropyloric gastric malignancy (stars), metastatic lymph nodes (white arrows), and multiple intraluminal tumour thrombi (black
arrows) in the inferior vena cava (IVC) [red arrow], with extraluminal infiltration of the IVC by right iliac lymph nodes (yellow arrow). (b) Coronal
and (c, d) axial CECT images of a 42-year-old woman with mucinous adenocarcinoma of the stomach show diffuse thickening of the gastric
wall (stars in [b] and [c]) and widespread metastatic lymph nodes with multiple tiny calcifications (blue arrows in [b] and [c]). A focal intraluminal
thrombus in the IVC (black arrows in [b] and [c]) and a long-segment thrombus in a dilated, non-enhancing right ovarian vein (green curved
arrows in [b] and [d]) are evident. The left ovarian vein (yellow arrows in [b] and [d]) is compressed by retroperitoneal lymphadenopathy.

Figure 15. Two cases of ovarian cancer. (a) Coronal contrast-enhanced computed tomography (CECT) image of the abdomen of a 62-year-old
patient shows right ovarian malignancy (star) with an intraluminal thrombus in the inferior vena cava (IVC) [yellow arrow] and extraluminal
compression (green arrows) by enlarged lymph nodes (red arrows). (b, c) Coronal CECT images of the abdomen of a 53-year-old patient
show a complex cystic lesion in the pelvis and left adnexa (stars), with bland thrombi (black arrows) in the infrahepatic IVC (white arrows)
and the right renal vein (red arrows).
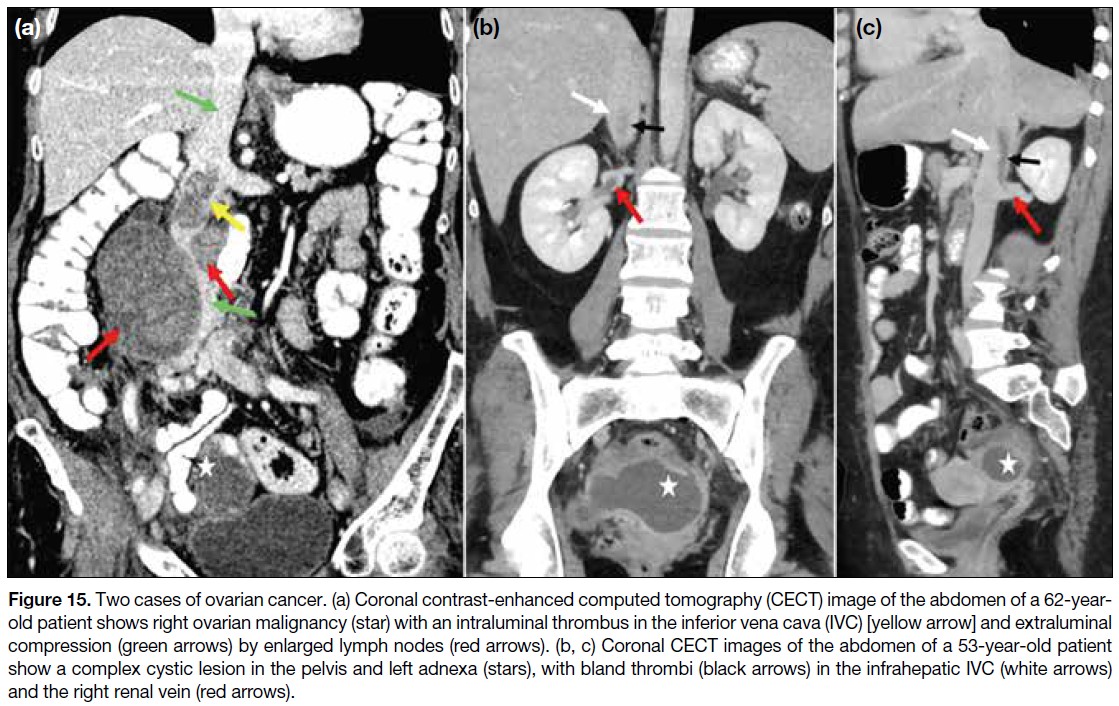
Tumour thrombus results either from direct extension of
the malignancy or embolisation of neoplastic cells into the
abdominal veins and/or the IVC. Differentiation between
bland and tumour thrombi is crucial for management:
anticoagulation or catheter-directed thrombolysis is
the mainstay of treatment for bland thrombus, whereas
tumour thrombus may require surgical resection (Table 3).[8] [13] [14] [15] In addition to tumour thrombectomy, adherent
tumour thrombus invading the IVC wall necessitates
en bloc excision, segmental resection, and vascular
reconstruction.[15] Magnetic resonance imaging is superior
to computed tomography in detecting and characterising
tumour thrombus, as well as in identifying vessel wall
invasion[8] (Figure 16). The extent of tumour thrombus
within the IVC and the right atrium, along with vessel
wall invasion, determines staging and resectability.
These two factors are also independent predictors of
adverse prognosis and poor survival rates in abdominal
malignancies.[7] [8]
Table 3. Differentiating imaging features between tumour thrombus and bland thrombus.[8] [13] [14] [15]
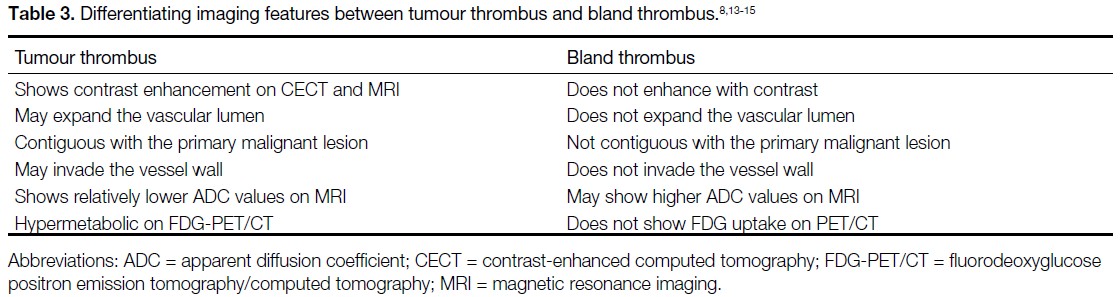
Figure 16. Renal cell carcinoma (RCC) involving the inferior vena cava (IVC) in three patients. (a) Patient 1. Axial contrast-enhanced
computed tomography (CECT) image shows left RCC (star) with an enhancing tumour thrombus in the dilated left renal vein (white arrow)
and a bland thrombus in the IVC (black arrow). (b) Patient 2. Coronal CECT image shows intense heterogeneous enhancement of right
upper-pole RCC (star), with an enhancing tumour thrombus in the right renal vein and IVC (black arrows), extending up to the right atrium.
(c) Patient 3. Axial T2-weighted magnetic resonance image shows left RCC (star) with tumour thrombus in the IVC (white arrow) focally
invading the IVC wall (red arrows).
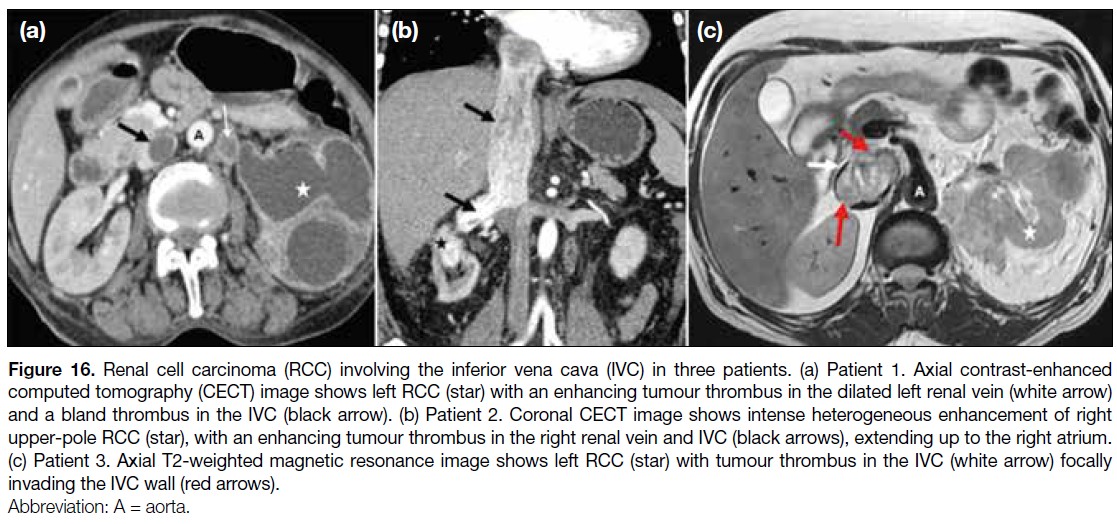
INFERIOR VENA CAVA IN
PAEDIATRIC MALIGNANCIES
Anatomical variants in the hepatic vasculature and the
IVC should be identified before segmental resection
in hepatoblastoma (Figure 17). Retroperitoneal
malignancies in children may involve the abdominal
vasculature, including the IVC (Figure 18). Thrombosis
and vascular displacement are more common in Wilms
tumours than vessel encasement, whereas vascular
invasion occurs more frequently in neuroblastomas[4] (Figure 19).
Figure 17. A 3-year-old child with biopsy-proven hepatoblastoma. (a) Greyscale and (b) colour Doppler ultrasound images show a mixed
echogenic lesion (star in [a]) in the liver with narrowing of the intrahepatic inferior vena cava (IVC) [white arrows in (b)]. (c) Coronal contrast-enhanced
computed tomography image of the abdomen shows a heterogeneously enhancing hypoattenuating lesion (star) in the right lobe
of the liver with pronounced luminal narrowing of the intrahepatic IVC (white arrow). Hepatomegaly with patchy heterogeneous parenchymal
enhancement and architectural distortion is also noted.
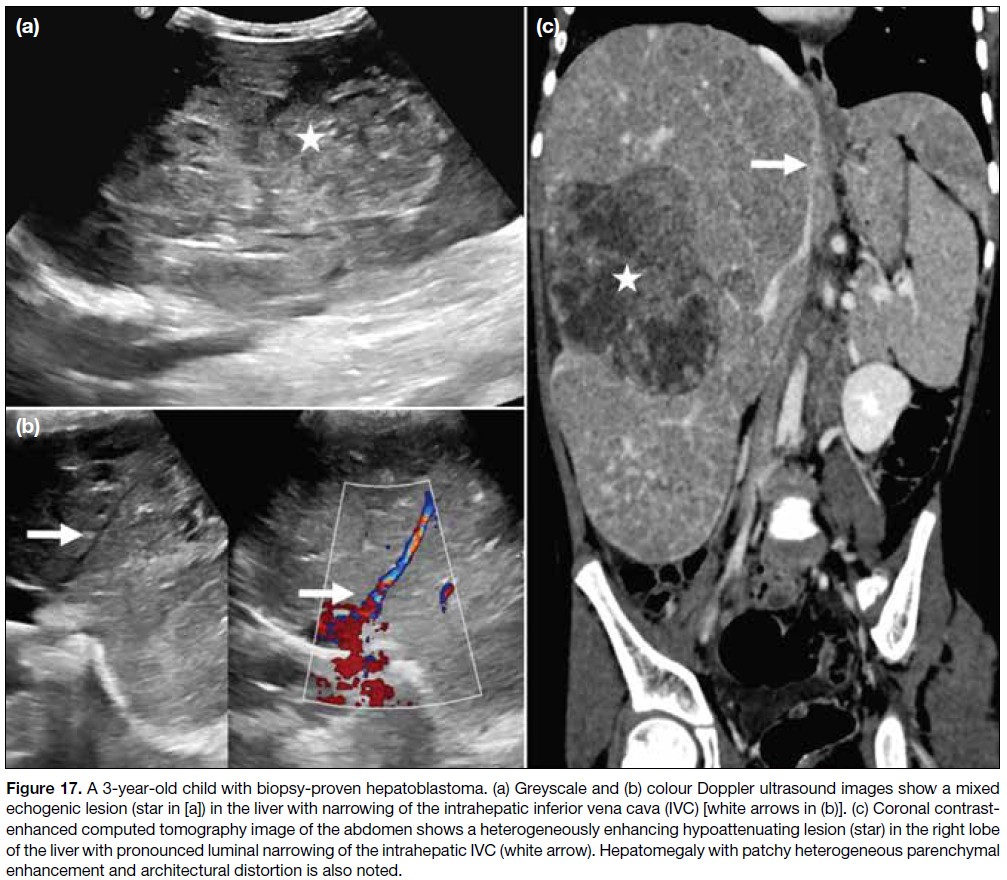
Figure 18. Retroperitoneal rhabdomyosarcoma in a 4-year-old child. (a) Axial, (b) coronal, and (c) sagittal contrast-enhanced computed
tomography images show a large heterogeneously enhancing soft tissue–attenuation mass (stars) partially encasing, compressing, and narrowing the inferior vena cava (white arrows), with infiltration of the vessel wall (red arrows in [a] and [b]).
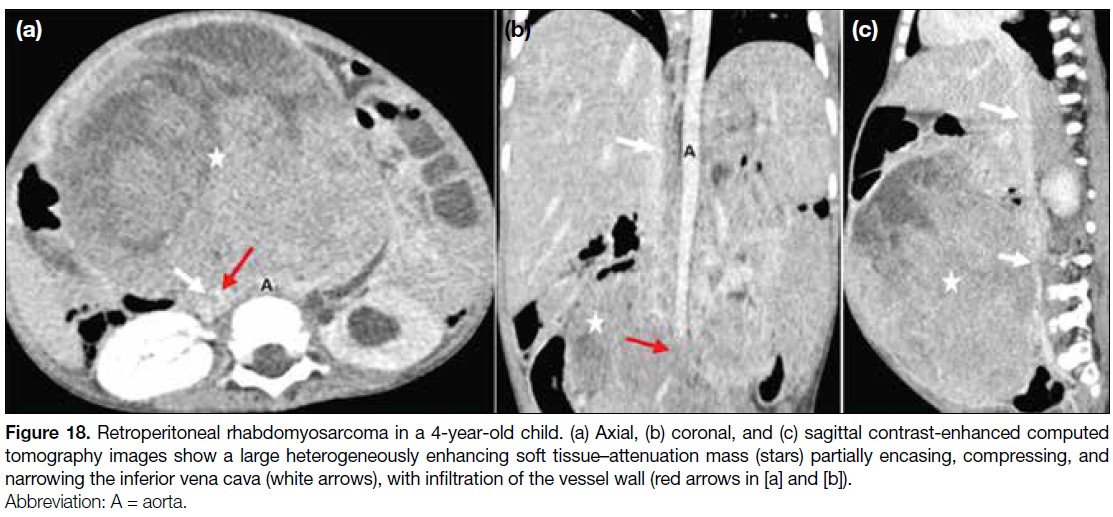
Figure 19. (a) Axial contrast-enhanced
computed tomography (CECT) and
corresponding (b) positron
emission tomography/computed tomography fusion
images of a 5-year-old child
with neuroblastoma of the
right adrenal gland show a
hypermetabolic enhancing
lesion with non-enhancing
necrotic areas in the right
suprarenal region (stars),
encasing and infiltrating the
inferior vena cava (IVC) [white
arrows]. (c) Axial and (d) coronal
CECT images of the abdomen
of a 7-year-old child with Wilms
tumour of the right kidney
show a large heterogeneously
enhancing tumour in the right
kidney (stars), with tumour
thrombus in the right renal vein
(black arrows). The lesion also
compresses the right lobe of the
liver and causes extraluminal
compression of the IVC (white arrows).
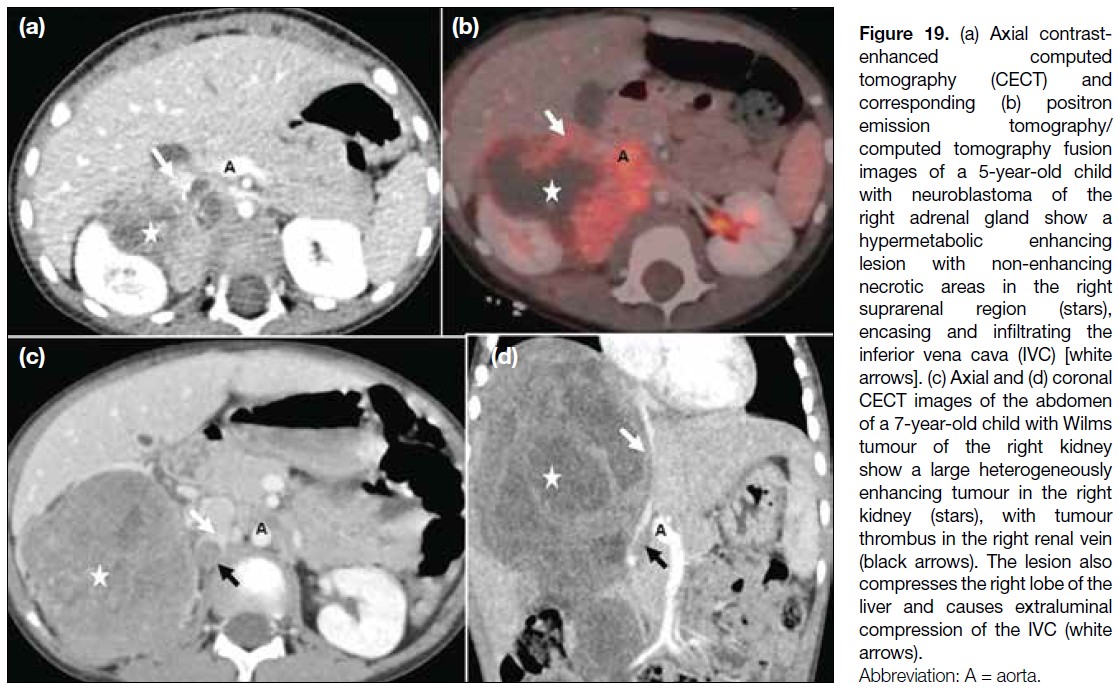
POSTSURGICAL COMPLICATIONS
Compression and narrowing of the IVC may occur
as immediate or delayed complications in patients
undergoing extensive retroperitoneal surgeries and
abdominal lymph node dissections (Figure 20).
Figure 20. Immediate postsurgical complications on day 8 after para-aortic nodal dissection. (a) Axial and (b) sagittal contrast-enhanced
computed tomography (CECT) images of the abdomen show a large hypodense collection (white arrows) causing extraluminal compression
of the infrarenal inferior vena cava (IVC) [red arrow in (b)]. Delayed postsurgical complications in a case of carcinoma of the testis, status
post-orchidectomy, and para-aortic lymphadenectomy demonstrate chronic IVC thrombosis with collateral formation. (c) Sagittal CECT
image of the abdomen shows significant luminal narrowing of the IVC (white arrow). (d) Coronal maximum intensity projection image
shows multiple dilated, tortuous collateral vessels in the pelvis and abdomen extending into the thoracic walls (white arrows), along with a
contracted right kidney (black arrow).
CONCLUSION
Comprehensive evaluation of the IVC and its tributaries
is a critical component of pre-surgical imaging. Cancer-associated
thrombosis of the IVC and abdominal veins
remains underrecognised and requires a high index
of clinical suspicion due to non-specific symptoms.
Identifying abnormal drainage patterns and congenital
variations, along with recognising intrinsic or extrinsic
involvement of the IVC by abdominopelvic malignancies,
is vital before undertaking major oncological surgery.
REFERENCES
1. Eitler K, Bibok A, Telkes G. Situs inversus totalis: a clinical review. Int J Gen Med. 2022;15:2437–49.
Crossref
2. Bass JE, Redwine MD, Kramer LA, Huynh PT, Harris JH Jr. Spectrum of congenital anomalies of the inferior vena cava: cross-sectional imaging findings. Radiographics. 2000;20:639–52.
Crossref
3. Malaki M, Willis AP, Jones RG. Congenital anomalies of the inferior vena cava. Clin Radiol. 2012;67:165–71.
Crossref
4. Smillie RP, Shetty M, Boyer AC, Madrazo B, Jafri SZ. Imaging evaluation of the inferior vena cava. Radiographics. 2015;35:578–92.
Crossref
5. Onbaș O, Kantarci M, Koplay M, Olgun H, Alper F, Aydınlı B, et al. Congenital anomalies of the aorta and vena cava: 16-detector-row CT imaging findings. Diagn Interv Radiol. 2008;14:163–71.
6. Alkhouli M, Morad M, Narins CR, Raza F, Bashir R. Inferior vena
cava thrombosis. JACC Cardiovasc Interv. 2016;9:629-43
Crossref
7. Jacob T, Modgil V, Rana KK, Das S. Multiple vascular anomalies in the abdomen—a gross anatomical study. Int J Morphol. 2008;26:563–6.
Crossref
8. Li SJ, Lee J, Hall J, Sutherland TR. The inferior vena cava: anatomical variants and acquired pathologies. Insights Imaging. 2021;12:123.
Crossref
9. Mahajan A, Brunson A, Adesina O, Keegan TH, Wun T. The incidence of cancer-associated thrombosis is increasing over time. Blood Adv. 2022;6:307–20.
Crossref
10. Abdol Razak NB, Jones G, Bhandari M, Berndt MC, Metharom P. Cancer-associated thrombosis: an overview of mechanisms, risk factors, and treatment. Cancers (Basel). 2018;10:380.
Crossref
11. Agnelli G, Bolis G, Capussotti L, Scarpa RM, Tonelli F, Bonizzoni E, et al. A clinical outcome–based prospective study on venous thromboembolism after cancer surgery: the @RISTOS project. Ann Surg. 2006;243:89–95.
Crossref
12. Teter K, Schrem E, Ranganath N, Adelman M, Berger J, Sussman R, et al. Presentation and management of inferior vena cava thrombosis. Ann Vasc Surg. 2019;56:17–23.
Crossref
13. Engelbrecht MR, Akin O, Dixit D, Schwartz L. Bland and tumor thrombi in abdominal malignancies: magnetic resonance imaging assessment in a large oncologic patient population. Abdom Imaging. 2011;36:62–8.
Crossref
14. Catalano OA, Choy G, Zhu A, Hahn PF, Sahani DV. Differentiation of malignant thrombus from bland thrombus of the portal vein in patients with hepatocellular carcinoma: application of diffusion‑weighted MR imaging. Radiology. 2010;254:154–62.
Crossref
15. Adams LC, Ralla B, Bender YY, Bressem K, Hamm B, Busch J,
et al. Renal cell carcinoma with venous extension: prediction
of inferior vena cava wall invasion by MRI. Cancer Imaging.
2018;18:17.
Crossref