
Magnetic Resonance Imaging of Brachial Plexus Pathologies: A Pictorial Essay
PICTORIAL ESSAY CME
Hong Kong J Radiol 2025 Mar;28(1):e55-65 | Epub 19 March 2025
Magnetic Resonance Imaging of Brachial Plexus Pathologies: A Pictorial Essay
WK Kung, TWY Chin, KC Lai, MK Chan
Department of Diagnostic and Interventional Radiology, Queen Elizabeth Hospital, Hong Kong SAR, China
Correspondence: Dr WK Kung, Department of Diagnostic and Interventional Radiology, Queen Elizabeth Hospital, Hong Kong SAR, China. Email: kwk178@ha.org.hk
Submitted: 11 January 2024; Accepted: 17 July 2024.
Contributors: WKK designed the study, acquired and analysed the data and drafted the manuscript. TWYC, KCL and MKC critically revised the manuscript for important intellectual content. All authors had full access to the data, contributed to the study, approved the final version for publication, and take responsibility for its accuracy and integrity.
Conflicts of Interest: All authors have disclosed no conflicts of interest.
Funding/Support: This study received no specific grant from any funding agency in the public, commercial, or not-for-profit sectors.
Data Availability: All data generated or analysed during the present study are available from the corresponding author on reasonable request.
Ethics Approval: This study was approved by the Research Ethics Committee (Kowloon Central/Kowloon East) of the Hospital Authority, Hong Kong (Ref No.: KC/KE-21-0228/ER-2). A waiver for written informed consent of patients was granted by the Committee as this manuscript was for pictorial review only and did not involve patients’ treatment/procedure.
INTRODUCTION
Magnetic resonance imaging (MRI) is the imaging
modality of choice to assess the brachial plexus given its
superb soft tissue contrast and lack of radiation.[1] It can
detect certain brachial plexus pathologies such as neural
and muscle oedema that computed tomography cannot.
Thorough anatomical knowledge is essential for
interpretation of brachial plexus–related diseases. In
this article, the anatomy of the brachial plexus and some
of its disease entities are reviewed and illustrated with
relevant MRI images.
BASIC ANATOMY
Figure 1 shows the normal anatomy of the brachial
plexus. The brachial plexus is divided into five main
regions, namely, roots, trunks, divisions, cords, and
terminal branches. Some anatomical landmarks, such
as the interscalene triangle, clavicle, and subclavian
artery, serve as important reference points in image
interpretation.
Figure 1. Normal sagittal anatomy of the brachial plexus. (a) At the level just lateral to the neural foramina, the C5 to T1 nerves roots
are seen. The C8 and T1 nerve roots are separated by the first rib (R). (b) The C5 to T1 nerve roots are seen at the medial aspect of the
interscalene triangle formed by the anterior scalene muscle (AS) and the middle scalene muscle (MS). The subclavian artery (SA) is seen in
the anterior aspect of the interscalene triangle. (c) The superior trunk (ST), middle trunk (MT) and inferior trunk (IT) are seen just lateral to the
interscalene triangle. (d) Divisions (D) are seen at the retroclavicular region above the SA. The subclavian vein (SV) is anteroinferior to the
SA. (e) The lateral cord (LC), posterior cord (PC) and middle cord (MC) are seen around the axillary artery (AA) in the infraclavicular region,
forming a ‘paw-print’ configuration. The axillary vein (AV) is inferior to the AA. (f) The median nerve (MN), mucocutaneous nerve (MCN), ulnar
nerve (UN) and radial nerve (RN) are seen around the AA near the lateral border of the pectoralis minor muscle.
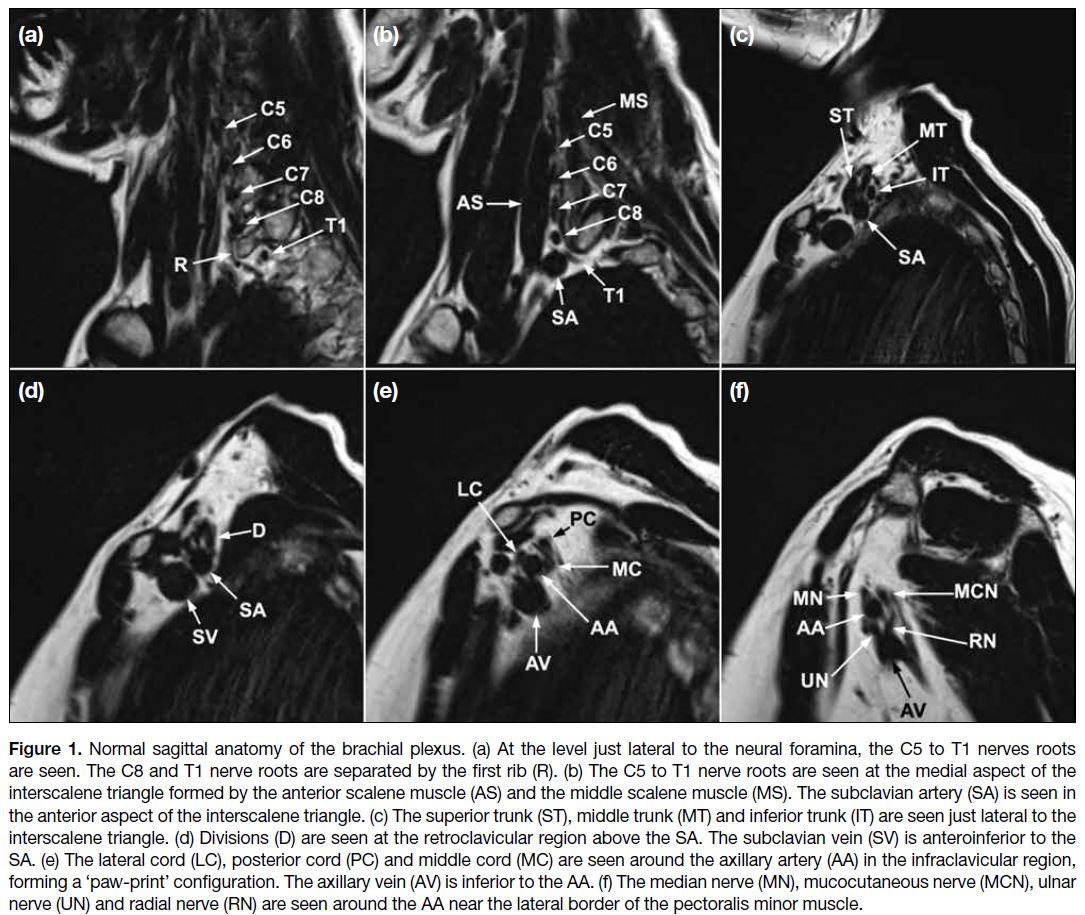
The brachial plexus typically originates from the ventral rami of spinal nerves C5 through T1. In the sagittal
plane, the first rib can help identify the C8 and T1
nerve roots, with the C8 nerve root above it and the T1
nerve root below it (Figure 1a). The roots, along with
the subclavian artery, course towards the interscalene
triangle formed by the anterior and middle scalene
muscles. The C5 to C7 nerve roots are superior to the
artery, while the C8 and T1 nerve roots are posterior to
the artery (Figure 1b). The roots merge to form three
trunks: the superior (formed by the C5 and C6 roots),
middle (the continuation of the C7 root), and inferior
trunks (formed by the C8 and T1 roots). These trunks
are seen at the lateral aspect of the interscalene triangle
(Figure 1c). The upper and middle trunks are superior to
the subclavian artery, while the lower trunk is posterior
to the subclavian artery. Each trunk divides into anterior
and posterior divisions at the lateral border of the first rib,
where the subclavian artery becomes the axillary artery.
The divisions can be identified superior to the axillary
artery in the retroclavicular region (Figure 1d). The six
divisions intermingle to form the three cords: the lateral,
posterior, and medial cords. They are found inferior to
the clavicle at the medial border of the coracoid process with a ‘paw-print’ configuration on sagittal images along
with the axillary artery. The cords are named according
to their position relative to the axillary artery. On sagittal
MRI, the lateral cord is located most anteriorly, the
posterior cord most superiorly, and the medial cord most
posteriorly (Figure 1e). The cords give rise to the terminal
branches, which include the axillary, musculocutaneous,
median, ulnar, and radial nerves at the lateral border of
the pectoralis minor muscle. The latter four terminal
branches surround the axillary artery at this location
(Figure 1f).[2] [3] [4]
MAGNETIC RESONANCE IMAGING TECHNIQUES
MRI of the brachial plexus employs a series of sequences
to provide detailed visualisation of the complex network of nerves. These sequences include T1-weighted
imaging (T1WI), T2-weighted imaging (T2WI), and
fat-suppressed fluid-sensitive sequences such as short-tau
inversion recovery (STIR) and the Dixon sequences.
T1WI offers excellent anatomical detail for assessing
the nerves which appear hypointense against the
hyperintense fat. It is also useful in detecting masses
and assessing their relationship to adjacent structures.
Contrast-enhanced fat-suppressed T1WI sequence is
helpful in characterisation of pathologies in the brachial
plexus. T2WI, particularly when combined with fat
suppression techniques such as STIR, accentuates the
signals of the nerves, allowing for better identification
of pathological changes such as oedema, inflammation,
or infiltration by tumours. In our department, the Dixon
technique used in our standard protocol has the advantage of more robust fat suppression, improving the quality
of fat-suppressed T2WI.[5] It also enables simultaneous
acquisition of fat-suppressed (water-only) and non–fat-suppressed
images. Three-dimensional sequences such
as T1W magnetisation-prepared rapid gradient-echo or
T2W sampling perfection with application-optimised
contrasts using different flip angle evolution provide
high spatial resolution and multiplanar reconstruction
capabilities to visualise the complex anatomy of the
brachial plexus.
Diffusion-weighted imaging (DWI) and diffusion tensor
imaging (DTI) are often incorporated in the protocols
of brachial plexus MR neurography by analysing
the movement of water molecules. DWI effectively
suppresses background signals using techniques such as
STIR and heavy diffusion gradients, resulting in high-contrast
nerve images. This makes it particularly suitable
for identifying demyelinating diseases and neuropathies
throughout the body. DTI builds upon DWI by measuring
the direction of water movement, providing parameters
such as fractional anisotropy (FA) and radial diffusivity.
FA reflects the degree of organisation within nerve
fibres, while radial diffusivity indicates the integrity of
the nerves’ myelin sheaths, offering advantages over
traditional nerve conduction studies for diagnosing
and monitoring nerve degeneration and regeneration,
especially in cases of mild neuropathy. DTI also allows
for three-dimensional visualisation of the nerve fibre
tracts through tractography, which employs mathematical
constructions based on eigenvectors and FA.[6]
Axial and coronal images allow comparison with the
contralateral side if it is included in the field of view.
Sagittal images clearly demonstrate the anatomy of the
brachial plexus and its relationships to the surrounding
structures. Given the fact that the brachial plexus runs
obliquely from superomedial to inferolateral in the
coronal plane, alternative imaging planes such as axial
oblique, coronal oblique, and sagittal oblique images
can be used to visualise the brachial plexus along its true
short and long axes. The oblique sagittal images facilitate
the assessment of the fascicular structures of the nerves,
as the cross-sectional architecture is better depicted.[6]
TRAUMATIC PLEXOPATHY
In trauma, MRI is useful in localising nerve involvement
as well as determining the degree of chronicity of the
injury. In acute denervation, the denervated muscles
exhibit T2W hyperintense signals within days after the
injury. Chronic denervation results in loss of muscle bulk and fatty infiltration. Within the first 4 weeks after
injury, the muscles may show increased signals on
contrast-enhanced sequence, possibly due to sympathetic
vascular tone alteration.[4]
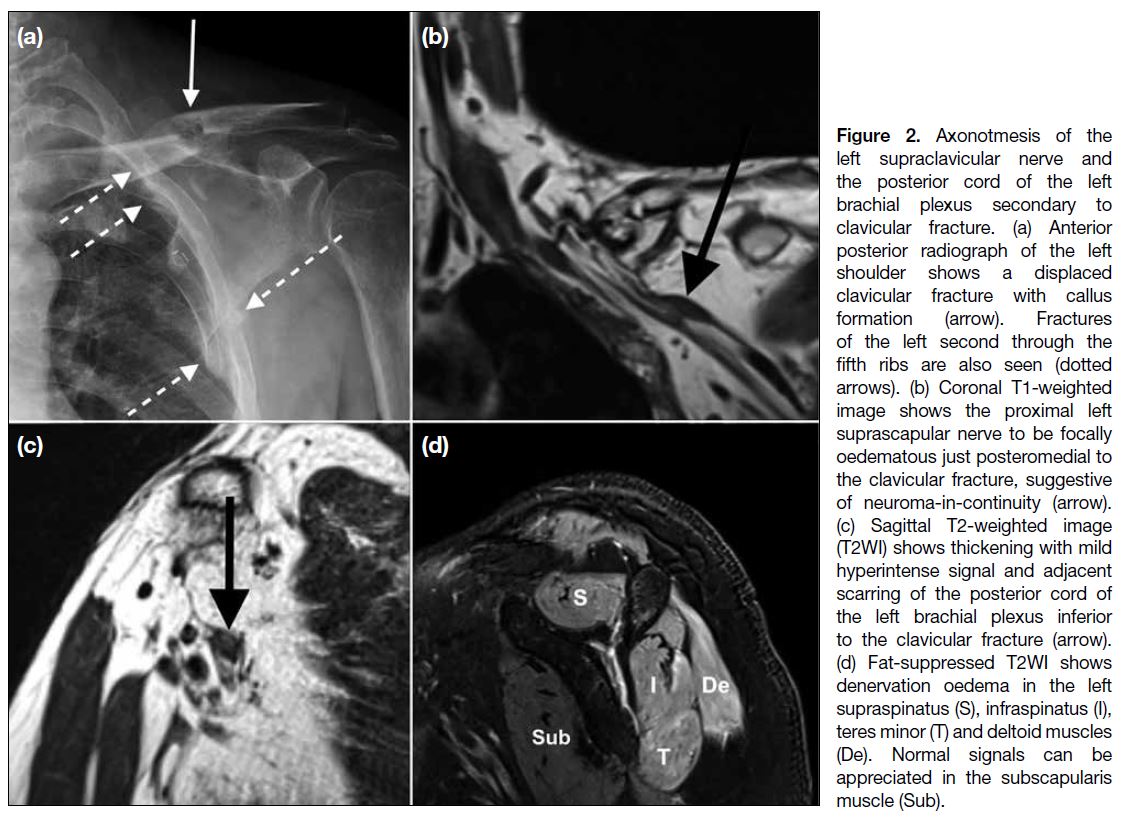
According to Seddon’s classification, there are three
types of nerve injury.[4] First-degree injury, also known
as neuropraxia, is the lowest grade and corresponds to
localised demyelination that does not disrupt the axon.
A more severe nerve injury is known as axonotmesis
or second-degree injury (Figure 2), which involves
the axon. Neurotmesis, or third-degree injury, is nerve
transection and is the most serious injury where no
axonal regeneration is possible. Generally, lower-grade
injuries are treated conservatively to encourage
spontaneous healing, while higher-grade injuries require
surgical intervention, including primary repair, nerve
graft placement, and nerve or myotendinous transfer.[4]
Figure 2. Axonotmesis of the
left supraclavicular nerve and
the posterior cord of the left
brachial plexus secondary to
clavicular fracture. (a) Anterior
posterior radiograph of the left
shoulder shows a displaced
clavicular fracture with callus
formation (arrow). Fractures
of the left second through the
fifth ribs are also seen (dotted
arrows). (b) Coronal T1-weighted
image shows the proximal left
suprascapular nerve to be focally
oedematous just posteromedial to
the clavicular fracture, suggestive
of neuroma-in-continuity (arrow).
(c) Sagittal T2-weighted image
(T2WI) shows thickening with mild
hyperintense signal and adjacent
scarring of the posterior cord of
the left brachial plexus inferior
to the clavicular fracture (arrow).
(d) Fat-suppressed T2WI shows
denervation oedema in the left
supraspinatus (S), infraspinatus (I),
teres minor (T) and deltoid muscles
(De). Normal signals can be
appreciated in the subscapularis muscle (Sub).
The distinction between preganglionic injury and
postganglionic injury is vital because preganglionic
injuries are deemed to be permanent, while postganglionic
injuries have a better chance of being surgically treated
or grafted.
Preganglionic Injury
Root avulsion may be clearly visible on MRI as
disconnection of the ventral or dorsal nerve roots from
the spinal cord (Figure 3). The roots can retract over the
neural foramen and into the supraclavicular fossa, which
is more prevalent in high-energy traction injury.
Figure 3. Preganglionic injury of
the left C8 and T1 nerve roots. (a)
Sagittal T2-weighted image (T2WI)
shows small cerebrospinal fluid–filled structures near the left C7/T1 and T1/T2 intervertebral foramina
in a trauma patient, compatible
with pseudomeningoceles (arrows).
(b) A torn C8 nerve root (dotted
arrow) at the lateral aspect of the
C7/T1 pseudomeningocele (arrow)
is identified on axial fat-suppressed T2WI.
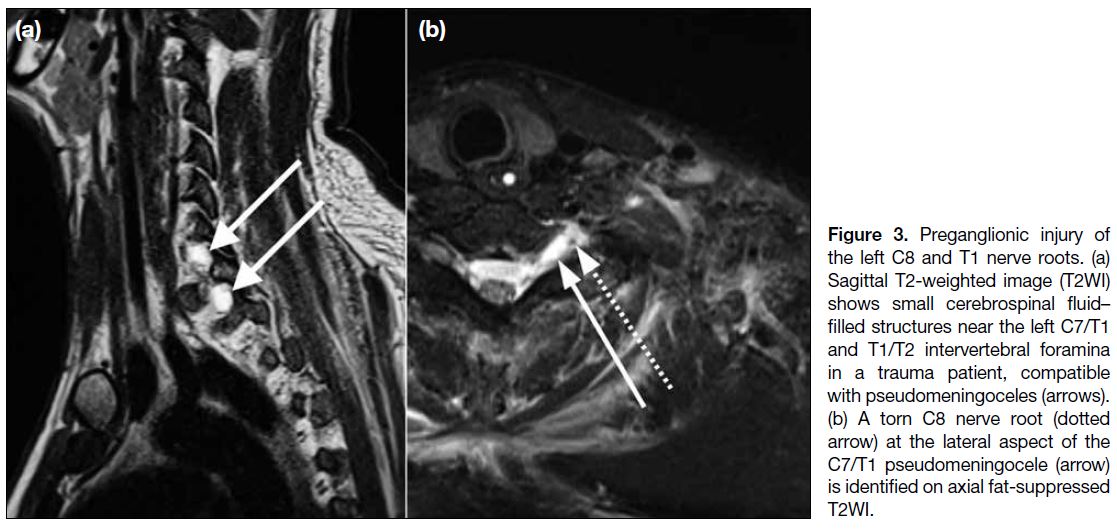
Imaging of suspected preganglionic damage is best
performed at least 3 to 4 weeks after injury since this
allows for resolution of acute oedema and subarachnoid
haemorrhage as well as detection of any development of
pseudomeningocele caused by a leak of cerebrospinal
fluid through a meningeal tear, one of the most significant
secondary findings of root avulsion. Pseudomeningocele
may present as a massive cystic collection extending
through a neural foramen and communicating with the
subarachnoid space. It develops upon root avulsion
because the nerve epineurium and outer perineurium are
continuous with the dura mater and arachnoid mater.[4]
Postganglionic Injury
Postganglionic traumatic brachial plexopathy may
manifest as focal calibre change or discontinuity of the
nerve, loss of fascicular architecture, neuroma formation,
perineural fibrosis, or abnormal nerve signal intensity
on MRI. The area of nerve discontinuity is typically best seen on coronal or axial views, with abnormal
hyperintensity and contour irregularities on T2WI. The
distance between the discontinuous proximal and distal
nerve extremities (nerve gap) in cases of neurotmesis
should be reported because it may influence the planning
of surgical repair.[4]
BENIGN NEOPLASMS
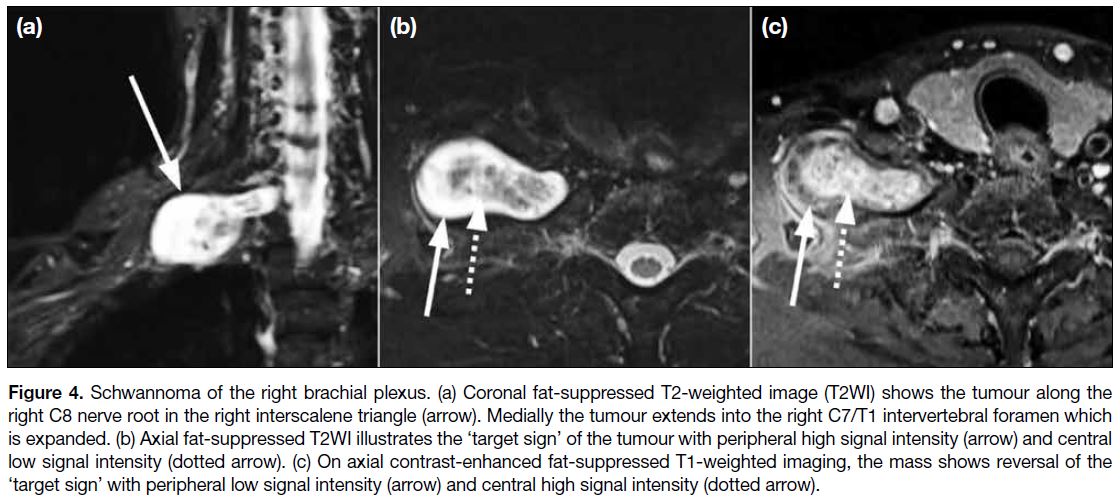
Benign Nerve Sheath Tumours
More than 90% of primary brachial plexus tumours
are benign nerve sheath tumours. Schwannomas make
up approximately 90% of benign brachial plexus nerve
sheath tumours, while neurofibromas constitute the
remaining 10%.[7] Schwannomas are characterised by
being outside the nerve fascicles. They have a well-defined
capsule and are essentially eccentric nerve sheath
tumours. They cause displacement of the nerve fascicles,
allowing resection without injuring the nerve. Cystic
components are occasionally be seen in schwannomas.
Neurofibromas, however, lack a capsule and invade the
nerve fascicles, making resection of the tumour without
damaging the nerves challenging.[7]
Schwannomas and neurofibromas appear
homogeneously hyperintense on T2WI. They are oval
lesions with smooth, circumscribed margins along
the longitudinal axis of the nerve on MRI (Figure 4).[3]
Neurofibromas are more likely to show the ‘target
sign’ of central T2WI hypointensity and peripheral
T2WI hyperintensity. The ‘reverse target sign’ may
be demonstrated on T1WI following gadolinium contrast administration, in which there is enhancement
of the central collagenous component with relative
hypoenhancement of the peripheral myxoid component.
This correlates histologically to a core region of collagen
surrounded by myxomatous tissue. The ‘target sign’,
however, is present in just a portion of neurofibromas
and malignant peripheral nerve sheath tumours
(MPNSTs).[8]
Figure 4. Schwannoma of the right brachial plexus. (a) Coronal fat-suppressed T2-weighted image (T2WI) shows the tumour along the
right C8 nerve root in the right interscalene triangle (arrow). Medially the tumour extends into the right C7/T1 intervertebral foramen which
is expanded. (b) Axial fat-suppressed T2WI illustrates the ‘target sign’ of the tumour with peripheral high signal intensity (arrow) and central
low signal intensity (dotted arrow). (c) On axial contrast-enhanced fat-suppressed T1-weighted imaging, the mass shows reversal of the
‘target sign’ with peripheral low signal intensity (arrow) and central high signal intensity (dotted arrow).
Other Benign Tumours
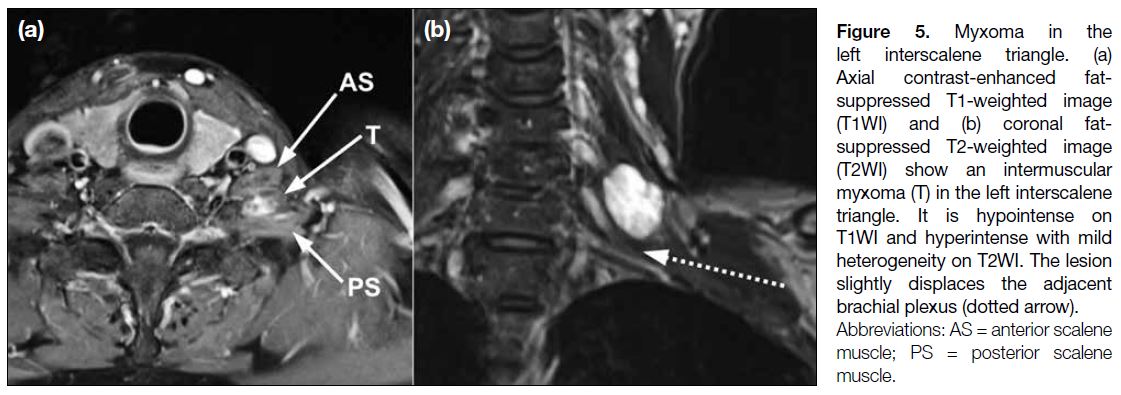
Myxoma is a mesenchymal neoplasm characterised
by undifferentiated stellate cells within a myxoid
stroma. The majority of myxomas are intramuscular;
intermuscular, subcutaneous, and juxta-articular
myxomas are uncommon. Myxomas show low-to-intermediate
signals on T1WI and hyperintense signals
on unenhanced T2WI (Figure 5). They are usually well-defined
and homogeneous to mildly heterogeneous.
A thin rim of fat that indicates atrophy of the nearby
muscle is commonly seen in intramuscular myxomas,
most prominently at the superior and inferior aspects
of the lesion. Perilesional high signal on fluid-sensitive
sequences can be seen in most of the myxomas due to
leakage of the myxomatous materials into surrounding
muscle resulting in oedema. Myxomas can exhibit mild
to moderate contrast enhancement in a homogeneous
pattern or a thick rim and septal pattern. Cystic regions
are present in slightly more than half of all myxomas.[8]
Figure 5. Myxoma in the
left interscalene triangle. (a)
Axial contrast-enhanced fat-suppressed
T1-weighted image
(T1WI) and (b) coronal fat-suppressed
T2-weighted image
(T2WI) show an intermuscular
myxoma (T) in the left interscalene
triangle. It is hypointense on
T1WI and hyperintense with mild
heterogeneity on T2WI. The lesion
slightly displaces the adjacent
brachial plexus (dotted arrow).
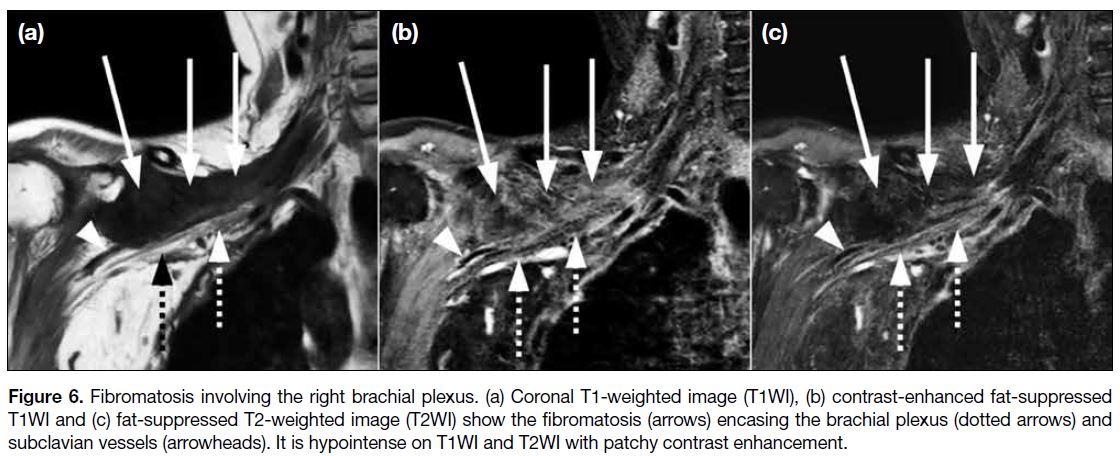
Fibromatoses are made up of spindle-shaped fibrous cells that are separated and surrounded by an abundance of collagen material with rare mitoses. Their aggressiveness
is intermediate between that of benign fibrous lesions
and fibrosarcomas. Fibromatoses are divided into two
main groups, namely, superficial (fascial) and deep
(musculoaponeurotic). Superficial fibromatoses are
typically small, slow-growing lesions that originate
in the fascia and aponeurosis. Deep fibromatoses
commonly originate in the deep fascia surrounding
muscle and aponeurotic tissue, and are more extensive
and aggressive. It can be challenging to entirely resect
the tumour, which has a propensity to recur.
MRI of deep fibromatosis typically shows hypointense
signals on T1WI and T2WI if the lesion has abundant
collagen with hypocellularity (Figure 6). The lesion
shows hyperintensity on T2WI if the lesion is highly cellular. Deep fibromatoses typically demonstrate
moderate to marked contrast enhancement, particularly
in collagen-deficient and cellular regions. Only 10% of
lesions lack significant enhancement.[9]
Figure 6. Fibromatosis involving the right brachial plexus. (a) Coronal T1-weighted image (T1WI), (b) contrast-enhanced fat-suppressed
T1WI and (c) fat-suppressed T2-weighted image (T2WI) show the fibromatosis (arrows) encasing the brachial plexus (dotted arrows) and
subclavian vessels (arrowheads). It is hypointense on T1WI and T2WI with patchy contrast enhancement.
MALIGNANT NEOPLASMS
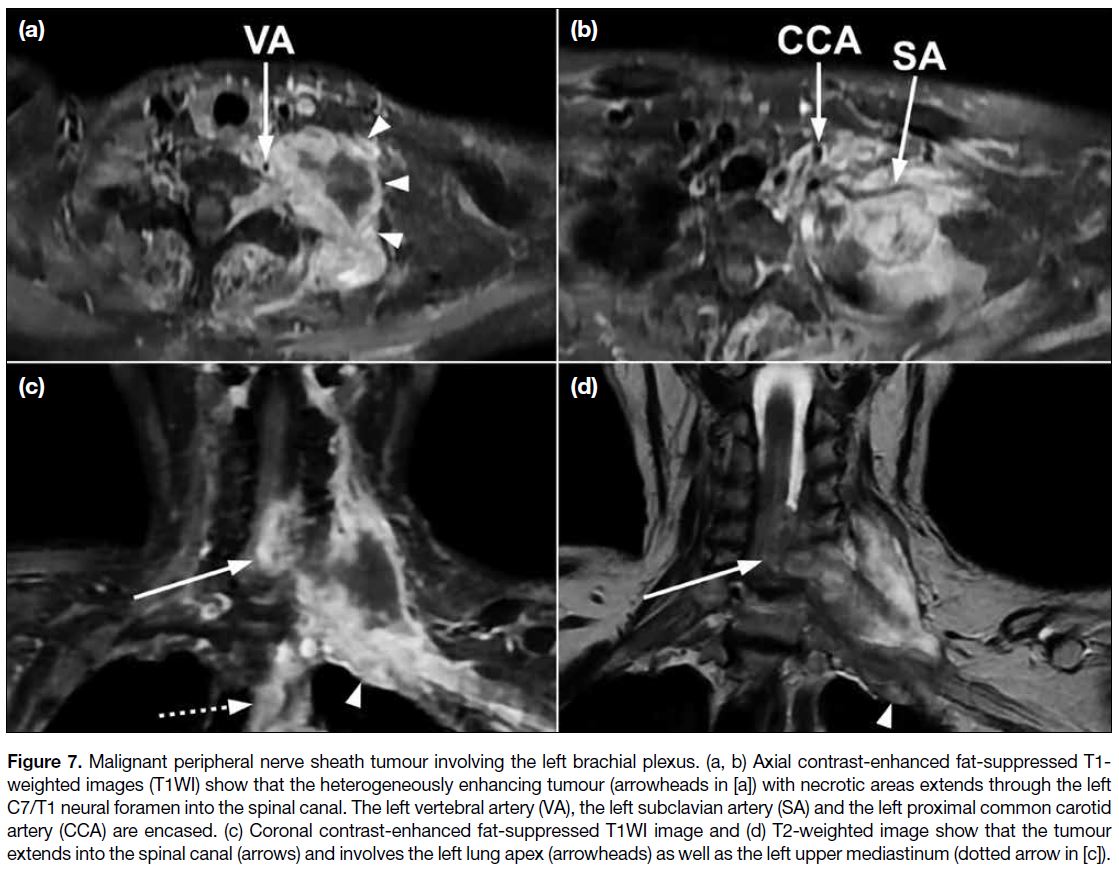
Malignant Peripheral Nerve Sheath Tumours
MPNSTs are the most common malignant tumour in the
brachial plexus. Approximately 50% of MPNSTs are
associated with neurofibromatosis type 1, while the other
half are sporadic.[10] A small proportion of MPNST cases
are associated with a history of prior radiotherapy with
the field covering the brachial plexus, with an average
latency period of 15 years.[10]
Imaging cannot reliably distinguish between benign and malignant peripheral nerve sheath tumours but is useful
in detecting suspicious features that can aid direct biopsy
or resection.[3] Suspicious features of MPNST include
large size, a perilesional oedema-like zone, a peripheral
enhancement pattern, and intratumoural cystic lesion
as a result of haemorrhage or necrosis (Figure 7). The
presence of two to four of these features is suggestive
of malignancy with high specificity (90%) but limited
sensitivity (61%). Heterogeneity on T1WI is an additional
suspicious feature for those MPNST cases associated
with neurofibromatosis type 1.[11] Significant diffusion
restriction, particularly at a minimal apparent diffusion
coefficient <1.0 mm2/s, also suggests malignancy.[4]
Figure 7. Malignant peripheral nerve sheath tumour involving the left brachial plexus. (a, b) Axial contrast-enhanced fat-suppressed T1-weighted images (T1WI) show that the heterogeneously enhancing tumour (arrowheads in [a]) with necrotic areas extends through the left
C7/T1 neural foramen into the spinal canal. The left vertebral artery (VA), the left subclavian artery (SA) and the left proximal common carotid
artery (CCA) are encased. (c) Coronal contrast-enhanced fat-suppressed T1WI image and (d) T2-weighted image show that the tumour
extends into the spinal canal (arrows) and involves the left lung apex (arrowheads) as well as the left upper mediastinum (dotted arrow in [c]).
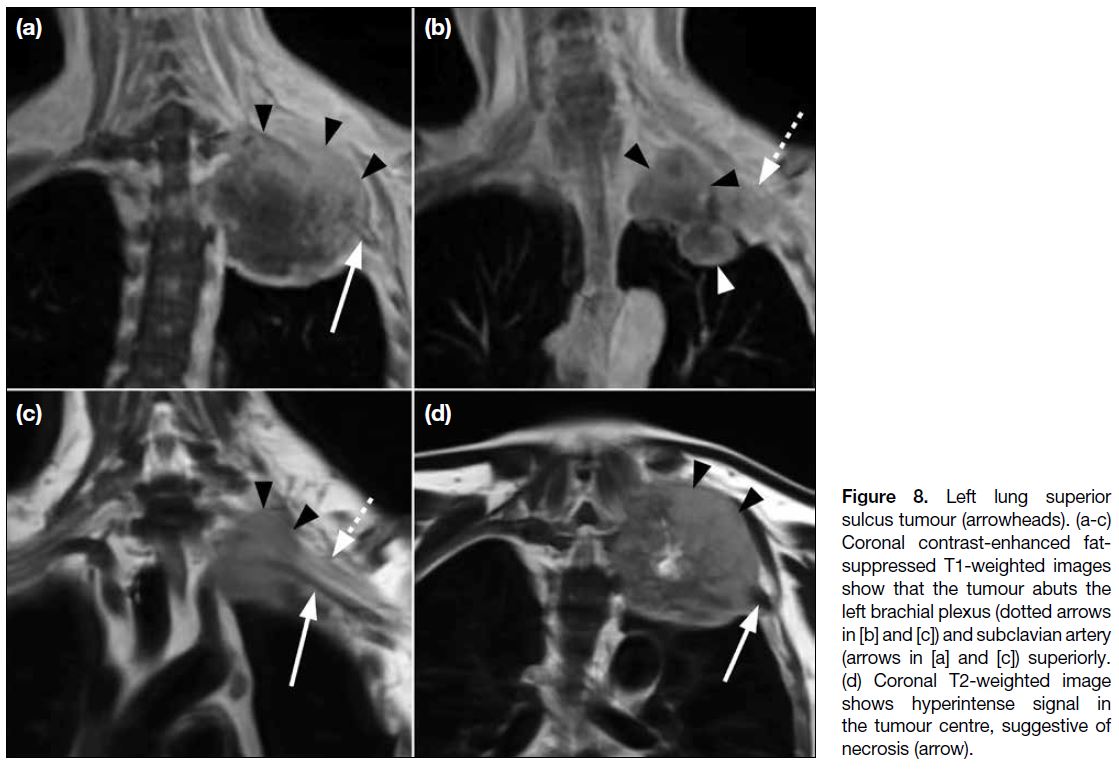
Superior Pulmonary Sulcus Tumour
The term ‘superior pulmonary sulcus tumour’ is
typically applied to all non–small cell lung carcinomas
that originate from the lung apex and invade the chest
wall or soft tissues of the thoracic inlet, regardless of the symptom complex. It accounts for 3% of all lung
malignancies and is associated with poor prognosis in
the majority of cases.[12]
Since the brachial plexus is surrounded by connective
tissue, a tumour can indent the brachial plexus and
displace the nerve roots or trunks superiorly without
actually invading them, which is shown as loss of
the intervening fat plane separating the apical pleura
from the T1 nerve root and subclavian artery on MRI
(Figure 8). Loss of sensory function may be the result
of extrinsic nerve compression, whereas loss of motor
function is more likely due to nerve invasion. To avoid
overestimating brachial plexus involvement when
evaluating the local extent of a tumour, it is crucial to
correlate imaging findings with the patient’s symptoms.[11]
Notably, invasion of the brachial plexus roots or trunks
at a level above T1 is an absolute contraindication to
surgery.
Figure 8. Left lung superior
sulcus tumour (arrowheads). (a-c)
Coronal contrast-enhanced fat-suppressed
T1-weighted images
show that the tumour abuts the
left brachial plexus (dotted arrows
in [b] and [c]) and subclavian artery
(arrows in [a] and [c]) superiorly.
(d) Coronal T2-weighted image
shows hyperintense signal in
the tumour centre, suggestive of
necrosis (arrow).
Other Primary Malignant Tumours
Primary malignant tumours arising from the surrounding
structures, such as soft tissue sarcoma and primary bone
tumours, can involve the brachial plexus, resulting in
neurological impairment (Figures 9 and 10). Certain tumours may have more specific MRI features. For
instance, tail-like tapering enhancement along the
adjacent fascial plane of the tumour (‘tail sign’) is
a common MRI feature of myxofibrosarcoma and
undifferentiated pleomorphic sarcoma.[13]
Figure 9. Myxofibrosarcoma in
the right supraclavicular fossa
(arrowheads). (a) Coronal contrast-enhanced
fat-suppressed T1-weighted image and (b) fat-suppressed
T2-weighted (T2W)
image show an irregular T2W
hyperintense tumour with
peripheral enhancement in the
right supraclavicular fossa.
Inferiorly, the mass indents the
right brachial plexus (arrows).
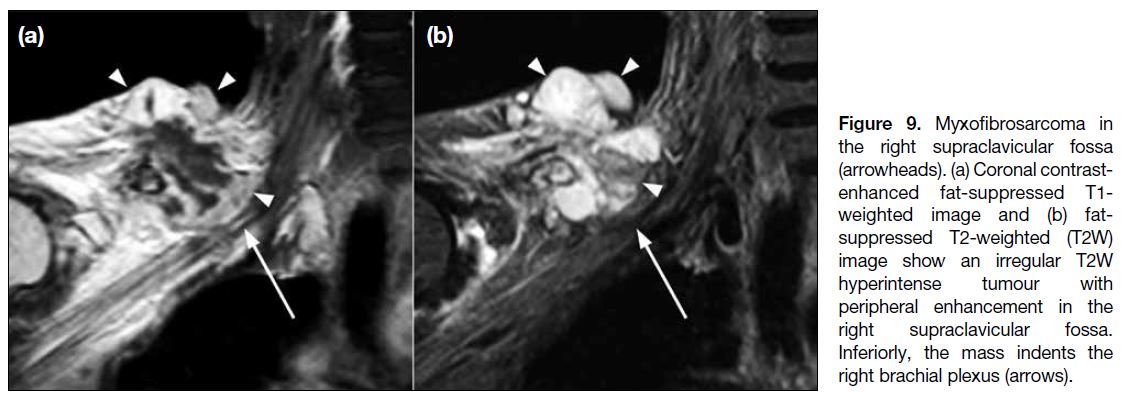
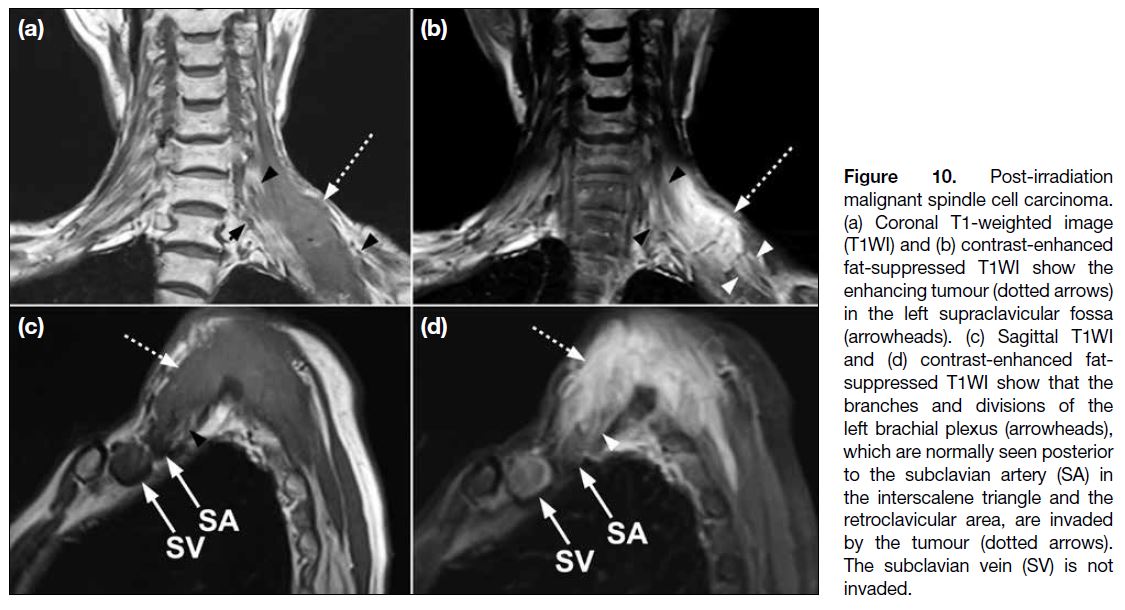
Figure 10. Post-irradiation
malignant spindle cell carcinoma.
(a) Coronal T1-weighted image
(T1WI) and (b) contrast-enhanced
fat-suppressed T1WI show the
enhancing tumour (dotted arrows)
in the left supraclavicular fossa (arrowheads).
(c) Sagittal T1WI and (d) contrast-enhanced
fat-suppressed T1WI
show that the branches and
divisions of the left brachial plexus
(arrowheads), which are normally
seen posterior to the subclavian
artery (SA) in the interscalene
triangle and the retroclavicular
area, are invaded by the tumour
(dotted arrows). The subclavian
vein (SV) is not invaded.
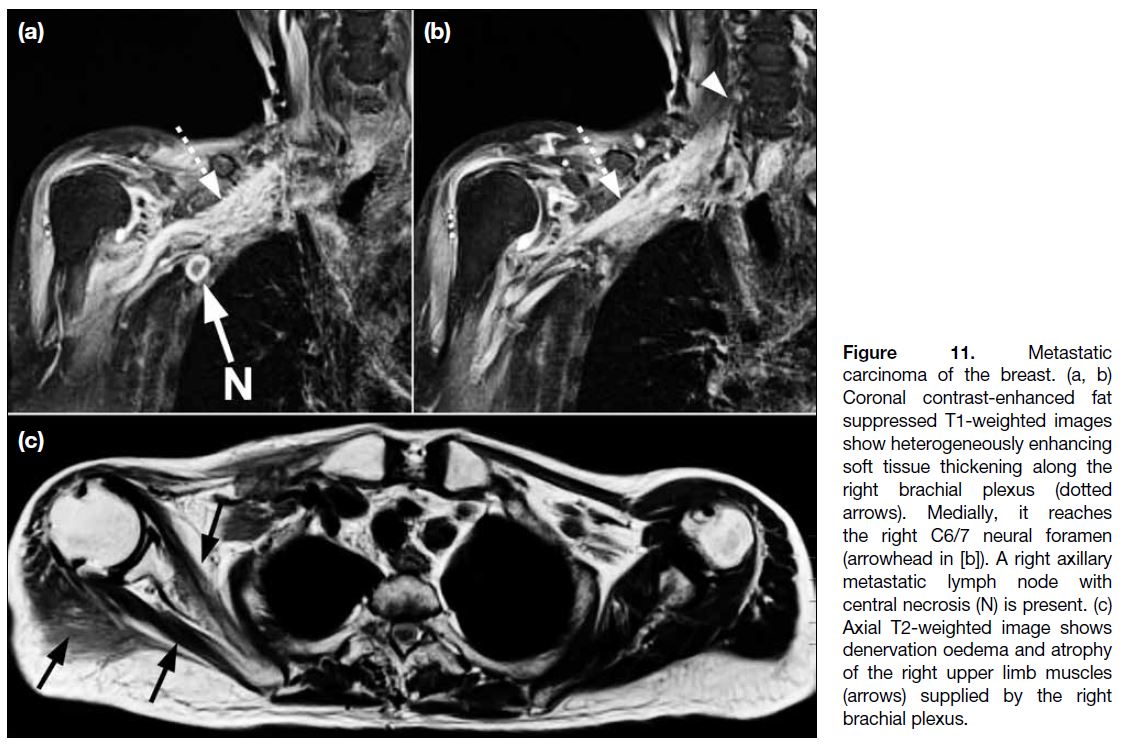
Metastatic Tumour Infiltration of the Brachial Plexus
Metastatic involvement of the brachial plexus occurs
mainly with breast, lung, and, less commonly, head and
neck cancers.[3] The plexopathy may be the result of mass
effect from adjacent tumour or direct nerve infiltration.
The medial cord is frequently involved in metastatic
breast cancer given its proximity to the axillary
venolymphatic drainage pathway. On MRI, metastasis
manifests as irregular or nodular enlargement and T2
hyperintensity of the affected nerves, which is typically
accompanied by enhancement (Figure 11).
Figure 11. Metastatic
carcinoma of the breast. (a, b)
Coronal contrast-enhanced fat
suppressed T1-weighted images
show heterogeneously enhancing
soft tissue thickening along the
right brachial plexus (dotted
arrows). Medially, it reaches
the right C6/7 neural foramen
(arrowhead in [b]). A right axillary
metastatic lymph node with
central necrosis (N) is present. (c)
Axial T2-weighted image shows
denervation oedema and atrophy
of the right upper limb muscles
(arrows) supplied by the right
brachial plexus.
INFLAMMATORY PLEXOPATHY
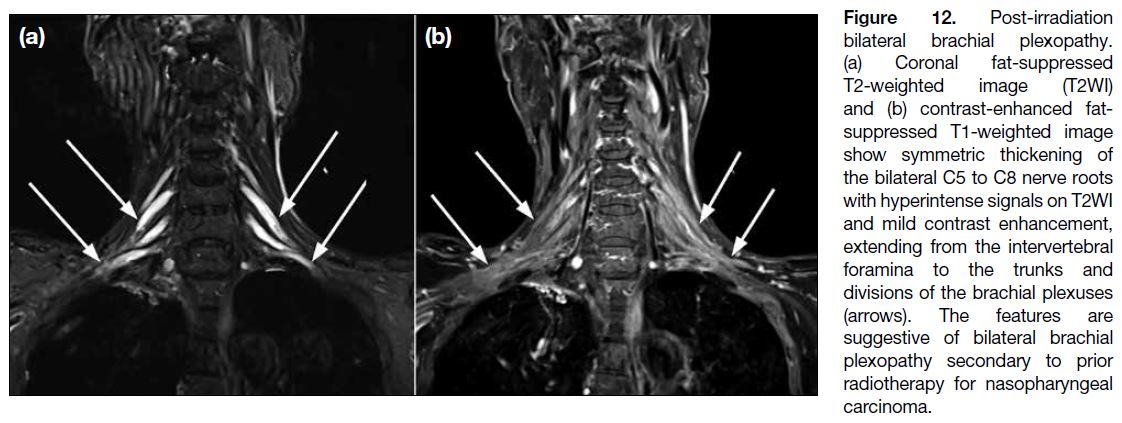
Post-radiation Neuropathy
Radiation-induced brachial plexopathy usually manifests
between 6 months and 20 years after treatment. On
MRI, post-radiation plexopathy is characterised by
smooth longitudinal thickening of the nerves, frequently
accompanied by T2W hyperintense signals and
longitudinal thin enhancement (Figure 12). Associated
perineural fibrosis appears as ill-defined tissue that
effaces the normal perineural fat planes on T1WI. It is
usually isointense to hypointense on T2WI but can be
hyperintense in the presence of vascularised scar tissue.
In comparison, tumour or perineural metastasis may have similar signal characteristics on T1WI and T2WI but is
more likely to appear as a nodular, discrete enhancing
lesion.[4]
Figure 12. Post-irradiation
bilateral brachial plexopathy.
(a) Coronal fat-suppressed
T2-weighted image (T2WI)
and (b) contrast-enhanced fat-suppressed
T1-weighted image
show symmetric thickening of
the bilateral C5 to C8 nerve roots
with hyperintense signals on T2WI
and mild contrast enhancement,
extending from the intervertebral
foramina to the trunks and
divisions of the brachial plexuses
(arrows). The features are
suggestive of bilateral brachial
plexopathy secondary to prior
radiotherapy for nasopharyngeal
carcinoma.
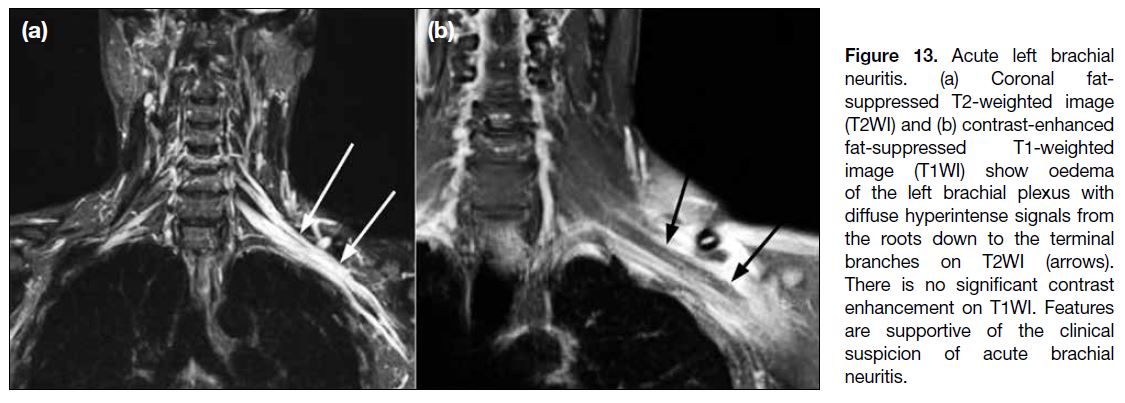
Acute Brachial Neuritis
Acute brachial neuritis, also known as Parsonage-Turner syndrome or idiopathic neuralgia amyotrophy,
classically manifests as acute onset of pain of the upper
extremity lasting for hours to weeks, followed by
numbness and weakness. The cause of this condition is
not known but predisposing factors include infection,
minor trauma, unaccustomed strenuous exercise,
childbirth, and surgery. The diagnosis is usually made
clinically with electromyographic testing and imaging
as adjuncts. On MRI, the involved plexus shows
hyperintense signals with or without mild thickening
on T2WI (Figure 13). Roots are the most common site
of involvement, followed by trunks and cords.[14] The C5
root is the most common nerve root involved while the
lateral cord is the most common cord involved.[3] The
most frequently affected nerve is the suprascapular
nerve, followed by the axillary nerve.[15] Muscular
denervation changes with intramuscular oedema and
various degrees of fatty atrophy are typical, most
commonly affecting the supraspinatus and infraspinatus
muscles.[16]
Figure 13. Acute left brachial
neuritis. (a) Coronal fat-suppressed
T2-weighted image
(T2WI) and (b) contrast-enhanced
fat-suppressed T1-weighted
image (T1WI) show oedema
of the left brachial plexus with
diffuse hyperintense signals from
the roots down to the terminal
branches on T2WI (arrows).
There is no significant contrast
enhancement on T1WI. Features
are supportive of the clinical
suspicion of acute brachial
neuritis.
LIMITATIONS OF MAGNETIC RESONANCE IMAGING IN BRACHIAL PLEXUS ASSESSMENT
Apart from the general limitations of the MRI scan, such
as patients with metallic implants or claustrophobia, a
comprehensive MR neurography protocol often involves
multiple sequences in different planes to fully assess the plexus, further extending the overall scan duration.
Motion artifacts present a significant hurdle in achieving
clear and diagnostic images of the brachial plexus.
Even slight patient movements during the scan, whether
voluntary or involuntary, can obscure subtle findings
and compromise image quality. Respiratory motion, particularly affecting the infraclavicular region, can
significantly degrade image quality. While techniques
such as respiratory triggering can help mitigate this
issue, they may not eliminate it entirely and can further
lengthen scan times.
CONCLUSION
This article provides an overview of the basic anatomy
and common pathologies of the brachial plexus,
highlighting salient MRI findings to aid radiologists in
formulating accurate differential diagnoses and guiding
appropriate management.
REFERENCES
1. Torres C, Mailley K, Del Carpio O’Donovan R. MRI of the
brachial plexus: modified imaging technique leading to a better
characterization of its anatomy and pathology. Neuroradiol J.
2013;26:699-719. Crossref
2. Tharin BD, Kini JA, York GE, Ritter JL. Brachial plexopathy:
a review of traumatic and nontraumatic causes. AJR Am J
Roentgenol. 2014;202:W67-75. Crossref
3. van Es HW, Bollen TL, van Heesewijk HP. MRI of the brachial
plexus: a pictorial review. Eur J Radiol. 2010;74:391-402. Crossref
4. Gilcrease-Garcia BM, Deshmukh SD, Parsons MS. Anatomy,
imaging, and pathologic conditions of the brachial plexus.
Radiographics. 2020;40:1686-714. Crossref
5. Wang X, Harrison C, Mariappan YK, Gopalakrishnan K, Chhabra A, Lenkinski RE, et al. MR neurography of brachial plexus at 3.0 T with robust fat and blood suppression. Radiology. 2017;283:538-46. Crossref
6. Jung JY, Lin Y, Carrino JA. An updated review of magnetic resonance neurography for plexus imaging. Korean J Radiol. 2023;24:1114-30. Crossref
7. Griffith JF, Lalam RK. Top-ten tips for imaging the brachial
plexus with ultrasound and MRI. Semin Musculoskelet Radiol.
2019;23:405-18. Crossref
8. Walker EA, Fenton ME, Salesky JS, Murphey MD. Magnetic
resonance imaging of benign soft tissue neoplasms in adults. Radiol
Clin North Am. 2011;49:1197-217. Crossref
9. Robbin MR, Murphey MD, Temple HT, Kransdorf MJ, Choi JJ.
Imaging of musculoskeletal fibromatosis. Radiographics.
2001;21:585-600. Crossref
10. James AW, Shurell E, Singh A, Dry SM, Eilber FC. Malignant
peripheral nerve sheath tumor. Surg Oncol Clin N Am.
2016;25:789-802. Crossref
11. Wasa J, Nishida Y, Tsukushi S, Shido Y, Sugiura H, Nakashima H,
et al. MRI features in the differentiation of malignant peripheral
nerve sheath tumors and neurofibromas. AJR Am J Roentgenol.
2010;194:1568-74. Crossref
12. Bruzzi JF, Komaki R, Walsh GL, Truong MT, Gladish GW,
Munden RF, et al. Imaging of non–small cell lung cancer of the
superior sulcus: part 1: anatomy, clinical manifestations, and
management. Radiographics. 2008;28:551-60. Crossref
13. Yoo HJ, Hong SH, Kang Y, Choi JY, Moon KC, Kim HS, et al.
MR imaging of myxofibrosarcoma and undifferentiated sarcoma
with emphasis on tail sign; diagnostic and prognostic value. Eur
Radiol. 2014;24:1749-57. Crossref
14. Upadhyaya V, Upadhyaya DN, Bansal R, Pandey T, Pandey AK.
MR neurography in Parsonage-Turner syndrome. Indian J Radiol
Imaging. 2019;29:264-70. Crossref
15. Gaskin CM, Helms CA. Parsonage-Turner syndrome: MR imaging
findings and clinical information of 27 patients. Radiology.
2006;240:501-7. Crossref
16. Yarnold J, Brotons MC. Pathogenetic mechanisms in radiation fibrosis. Radiother Oncol. 2010;97:149-61. Crossref