
Magnetic Resonance Imaging of Ankle Syndesmotic Ligament Injuries: Comparison of Three-dimensional Isotropic Intermediate-weighted Fast Spin Echo with Conventional Two-dimensional Imaging
ORIGINAL ARTICLE
Magnetic Resonance Imaging of Ankle Syndesmotic Ligament
Injuries: Comparison of Three-dimensional Isotropic
Intermediate-weighted Fast Spin Echo with Conventional
Two-dimensional Imaging
JW Park1, SJ Lee1, HJ Choo1, HC Gwak2, DH Park2, MW Kim1
1 Department of Radiology, Inje University, Busan Palk Hospital, Busan, Korea
2 Department of Orthopedic Surgery, Inje University, Busan Palk Hospital, Busan, Korea
Correspondence: Prof SJ Lee, Department of Radiology, Inje University, Busan Palk Hospital, Busan, Korea. Email: sunjulee98@gmail.com
Submitted: 21 Sep 2018; Accepted: 2 Jan 2019.
Contributors: JWP, SJL, and MWK designed the study. All authors were responsible for acquisition of data and contributed to the analysis of
data. JWP, SJL, and HJC wrote the manuscript. All authors made critical revisions of the intellectual content of this article. All authors had full
access to the data, contributed to the study, approved the final version for publication, and take responsibility for its accuracy and integrity.
Conflicts of Interest: The authors have no conflicts of interest to disclose.
Funding/Support: This research was supported by the Ministry of Trade, Industry & Energy (MOTIE, Korea) under industrial Technology
Innovation Program. No.10062728. The funder had no role in study design, data collection / analysis / interpretation or manuscript preparation.
Ethics Approval: The research protocol was approved by the Institutional Review Board of Inje University Busan Paik Hospital (Ref 17-0181).
Abstract
Purpose
We sought to compare the diagnostic performance of three-dimensional (3D) isotropic intermediate-weighted
fast spin echo (FSE) magnetic resonance imaging (MRI) sequences with that of conventional two-dimensional (2D)
FSE sequences for the assessment of syndesmotic ligament injuries associated with ankle fractures.
Methods
Between January 2014 and December 2015, 37 patients who underwent both conventional 2D MRI and
3D MRI of an ankle fracture were evaluated. All patients underwent subsequent ankle arthroscopy. Two radiologists
retrospectively reviewed the imaging findings of syndesmotic ligament injury, with an interval of at least 2 weeks
between sessions of interpretation. Sensitivity, specificity, and accuracy were calculated for each ligament, and
McNemar’s paired proportion test was performed to compare the diagnostic performance.
Results
Injuries of the anterior inferior tibiofibular ligament were the most common finding in the patients
(31/37, 83.8%). The 3D sequences showed a sensitivity of 96.8% to 100% and a specificity of 50% to 66.7% in these
injuries, whereas the 2D sequences showed a sensitivity of 96.8% to 100% and a specificity of 33.3% to 66.7%
(p = 0.114-0.588). Injuries of the posterior inferior tibiofibular ligament and transverse tibiofibular ligament also
showed no significant difference in diagnostic accuracy between 2D and 3D sequences.
Conclusion
There was no statistically significant difference in the diagnostic performance of 3D FSE sequences
compared with that of 2D FSE sequences for syndesmotic ligament injuries associated with ankle fractures. The
3D MRI can be considered for syndesmotic ligament injury instead of 2D MRI, with shortened acquisition time.
Key Words: Ankle joint; Ligaments; Magnetic resonance imaging; Sensitivity and specificity; Wounds and injuries
中文摘要
高位踝關節韌帶損傷的磁共振成像:三維各向同性中間加權快速自旋回波磁共振成像與常規二維磁共振成像的比較
JW Park, SJ Lee, HJ Choo, HC Gwak, DH Park, MW Kim
目的
本研究旨在比較三維(3D)各向同性中間加權快速自旋回波(FSE)磁共振成像(MRI)序列與常規二維(2D)FSE序列於評估與踝部骨折相關高位踝關節韌帶損傷時的診斷表現。
方法
2014年1月至2015年12月期間,對37例同時進行常規2D MRI和3D MRI的踝關節骨折患者進行
評估。所有患者均接受踝關節鏡檢查。兩名放射科醫生回顧分析高位踝關節韌帶損傷的影像學表
現,兩次闡釋的時間相隔至少2週。計算每條韌帶的敏感性、特異性和準確性,並進行McNemar配對
比例測試以比較診斷表現。
結果
最常見為前下距腓韌帶(AITFL)損傷(31例,83.8%)。3D序列顯示對AITFL的敏感性為
96.8%至100%,特異性為50%至66.7%;2D序列顯示的敏感性為96.8%至100%;特異性為33.3%至
66.7%(p = 0.114-0.588)。後下距腓韌帶(PITFL)和脛骨橫韌帶(TrTFL)損傷在2D和3D序列的診
斷中沒有顯著差異。
結論
3D FSE序列與2D FSE序列於與踝部骨折相關高位踝關節韌帶損傷的診斷表現無統計學差異。可考慮使用3D序列MRI代替2D圖像進行高位踝關節韌帶損傷檢查,縮短採集時間。
INTRODUCTION
Ankle disorders are a relatively common pathological
condition, and ankle injuries account for approximately
14% of sports-related orthopaedic emergency visits.[1]
Ligamentous injuries occurring with ankle fractures
have a significant impact on ankle instability; therefore,
identifying ligamentous injuries in the setting of ankle
fractures is critical for appropriate treatment decisions.
The ligaments of the ankle are composed of three
ligamentous groups: the syndesmotic ligament
complex, the lateral ligamentous complex, and the
deltoid ligament. The syndesmotic ligament complex is
composed of four separate ligaments: the anteroinferior
tibiofibular ligament (AITFL), the posteroinferior
tibiofibular ligament (PITFL), the transverse tibiofibular
ligament (TrTFL), and the interosseous ligament. The
syndesmotic ligaments stabilise the distal tibia and fibula
and are injured in 1% to 18% of all ankle sprains. This
rate increases to 12% to 32% of all ankle sprains among
athletes.[2] [3] [4] If diagnosis and appropriate treatment are
delayed, ligament injuries may lead to posttraumatic
arthritic changes and chondral defects over time. In
the absence of abnormal radiological findings, it may
be difficult to detect syndesmotic ligament damage on
arthroscopy due to its anatomical location.
To evaluate the ligamentous structure of the ankle joint,
variable imaging planes and sequences are required.
Increasing the number of imaging sequences inevitably
increases the scan time, but three-dimensional (3D)
isotropic images solve this problem. The use of 3D
isotropic sequences enables multiplanar reformatted
images and shortens the acquisition time by obtaining
the same sequence in different planes.[5] [6] [7] However,
most 3D magnetic resonance imaging (MRI) sequences
provide insufficient soft tissue contrast and therefore
have limited value in the evaluation of musculoskeletal
images, especially for ligament structures.[8] [9]
The aims of this study were to investigate whether the
image quality of 3D isotropic-weighted fast spin echo
(FSE) sequences is comparable to that of two-dimensional
(2D) T2-weighted FSE sequences for the assessment of
the syndesmotic ligaments and to compare the diagnostic
performance of 3D isotropic-weighted FSE sequences
with that of 2D T2-weighted FSE sequences.
METHODS
Subjects
Between January 2014 and December 2015, we
evaluated the images of 45 consecutive patients
with ankle fracture who had undergone preoperative ankle MRI. We excluded patients with a history of
underlying systemic pathological findings such as gouty
arthritis in the affected ankle (1 patient) or who did not
undergo operation in this hospital (7 patients). A total
of 37 patients were ultimately included in the analysis,
comprising 21 women (aged 21-82 years; mean age,
47 years) and 16 men (aged 24-78 years; mean age,
48 years). The mean interval (± standard deviation)
between trauma and MRI was 1.4 ± 2.3 days, and the
mean interval between MRI and operation was
2.4 ± 2.3 days. The requirement for patient informed
consent was waived because of the retrospective
nature of the study, and the study was approved by the
Institutional Review Board at Inje Medical University.
Imaging
All images were acquired using a 3.0-T MRI unit with
either a 16-channel phased array coil (Achieva; Philips,
Best, The Netherlands) [12 patients] or a 20-channel
phased array coil (Skyra; Siemens Healthcare, Erlangen,
Germany) [25 patients]. The patients were examined in the supine position with the ankle in neutral position
using a phased-array foot and ankle coil. Then, 2D
T2-weighted FSE images in the axial, coronal, and
sagittal planes as well as 3D isotropic-weighted FSE
images were acquired. The 3D intermediate-weighted
FSE images were obtained in the sagittal plane and then
reconstructed on the axial and coronal axes to increase
time efficiency. The number of sections in the cranial
to caudal direction was larger than that in the medial to
lateral direction. The parameters used for these imaging
sequences are listed in Tables 1 and 2.
Table 1. Imaging parameters for MRI sequences (Skyra).
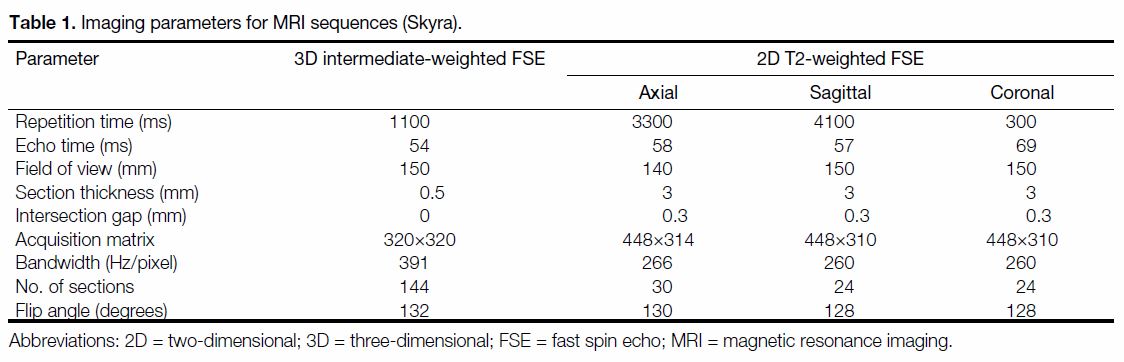
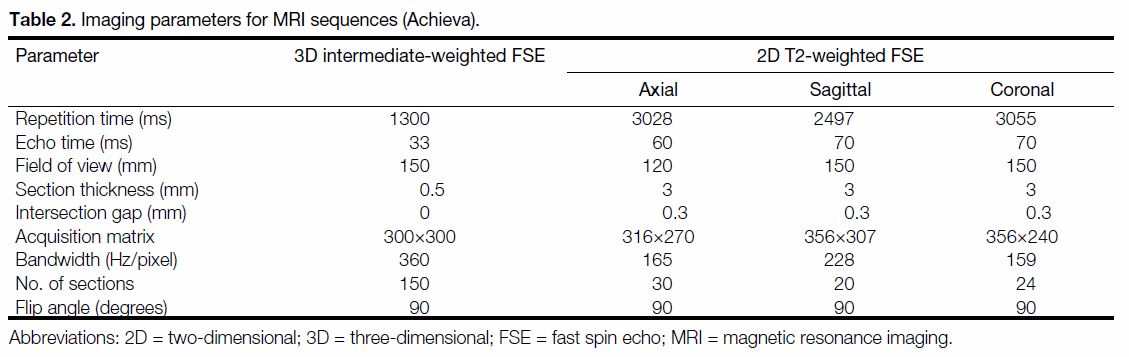
Table 2. Imaging parameters for MRI sequences (Achieva).
Imaging Interpretation
Two radiologists (one expert musculoskeletal radiologist
with 15 years of experience and one fourth-year
radiology resident), who were blinded to the surgical
findings, analysed the 2D and 3D imaging findings
independently. To minimise recall bias, each set of
magnetic resonance images was reviewed in a separate
setting with an interval of at least 2 weeks between the
two interpretation sessions.
To grade acute syndesmosis injury, the radiologists
classified the injury as ruptured (including complete
and partial tears) or unruptured (including normal and
oedematous ligaments). Complete tear was used to
describe the injury when there was definite discontinuity
or when the ligament was not visible, whereas partial tear
was used to describe the injury when ligaments presented
with laxity, irregular contour or partial discontinuity
without bony avulsion.[8]
Ankle Surgery
Arthroscopic findings were considered the reference
standard. One orthopaedic surgeon specialising in foot
and ankle surgery performed all surgical procedures
after assessment of the preoperative MRI findings.
Any abnormalities of the syndesmotic ligaments were
recorded during arthroscopy. All 37 acute fractures were
treated with internal fixation.
Statistical Analysis
Statistical analyses were performed using SPSS
(Windows version 22.0; IBM Corp, Armonk [NY],
United States) for a comparison of area under the
receiver operating characteristic curve (AUC) values.
We compared the diagnostic performance of 3D isotropic
intermediate T2-weighted FSE and conventional 2D
T2-weighted FSE sequences; the sensitivity, specificity,
and accuracy were calculated in relation to a reference
standard of arthroscopic diagnosis. McNemar’s paired
proportion test was used to measure the concordance of
2D and 3D sequences with the arthroscopic diagnosis.[10]
The AUC value was used to compare the discriminatory
power of the two imaging methods. AUC values range
between 0 and 1, with a higher value indicating better
overall performance of the diagnostic test.[11]
Interobserver agreement was calculated using Cohen’s
kappa test, where κ < 0 indicates no agreement,
0 < κ ≤ 0.2 indicates slight agreement, 0.2 < κ ≤ 0.4
indicates fair agreement, 0.4 < κ ≤ 0.6 indicates moderate
agreement, 0.6 < κ ≤ 0.8 indicates substantial agreement,
and 0.8 < κ ≤ 1 indicates almost perfect agreement.[12] For
the aforementioned statistical analyses, p < 0.05 were
considered statistically significant.
RESULTS
Arthroscopically confirmed diagnoses were used as
reference standards. In arthroscopic records, the AITFL
was most frequently ruptured (31/37, 83.8%), followed
by the PITFL (25/37, 67.6%) and TrTFL (5/37, 13.5%)
[Table 3]. Normal ligaments and those with oedema were included in the ‘unruptured’ group, and ligaments with
complete or partial tears were included in the ‘ruptured’
group. The sensitivity and specificity were calculated
for these categories. When diagnoses were classified as
‘unruptured’ or ‘ruptured’ for each syndesmotic ligament
injury associated with ankle fracture, the 3D sequences
showed a sensitivity of 96.8% to 100% and a specificity
of 50% to 66.7% for injuries of the AITFL, whereas the
2D sequences showed a sensitivity of 96.8% to 100%
and a specificity of 33.3% to 66.7% (p = 0.114-0.588)
[Figures 1 and 2]. The 3D sequences showed a sensitivity
of 60% and a specificity of 71.9% for injuries of the
PITFL, while the 2D sequences showed a sensitivity of
60% and a specificity of 68.8% to 71.9% (p = 0.317-1.0)
[Figure 3]. The 3D sequences showed a sensitivity of
52% to 60% and a specificity of 83.3% for injuries of the
TrTFL, whereas the 2D sequences showed a sensitivity
of 52% to 68% and a specificity of 83.3% (p = 0.417-1.0)
[Figure 4 and Table 4].
Table 3. Arthroscopic findings of syndesmotic ligament injury.
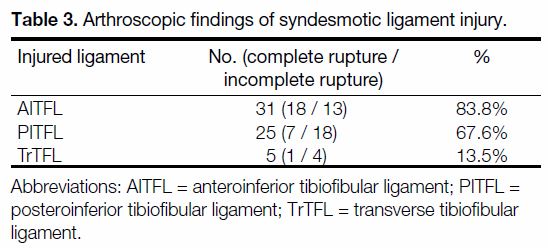
Figure 1. A 54-year-old man with a right distal tibiofibular fracture; concordance was observed between two-dimensional (2D) and threedimensional
(3D) sequence images. (a) 2D fat-suppressed T2-weighted fast spin echo sequence, (b) 2D intermediate-weighted sequence,
and (c) 3D isotropic intermediate-weighted axial images showing discontinuity of the anterior inferior tibiofibular ligament (AITFL) [arrows],
which is considered a tear. (d) Subsequent ankle arthroscopy showing a tear of the right AITFL in the right upper portion of the image (arrow).
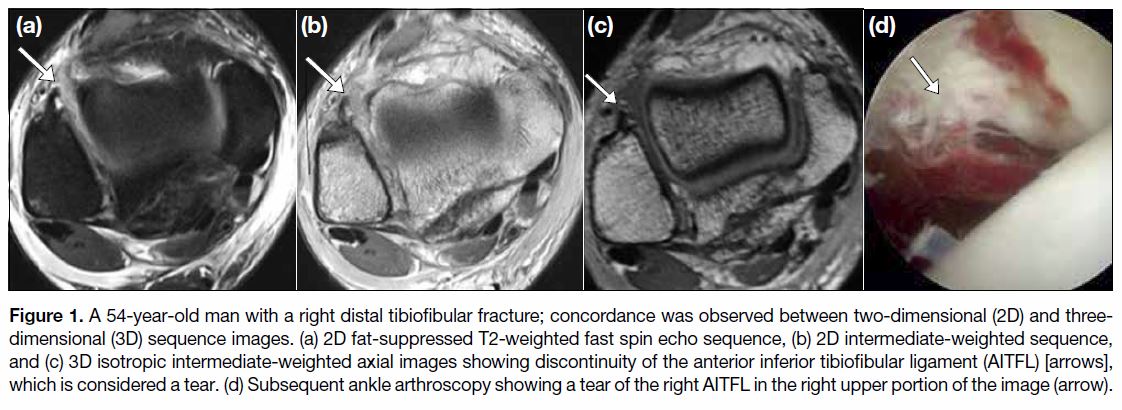
Figure 2. A 61-year-old woman with a left tibiofibular fracture; discordance was observed between two-dimensional (2D) and threedimensional
(3D) sequence images. (a) 2D fat-suppressed T2-weighted fast spin echo sequence and (b) 2D intermediate-weighted sequence
showing uncertain continuity and delineation of the left anterior inferior tibiofibular ligament (AITFL) [arrows], suggesting a complete tear.
(c) A 3D isotropic intermediate-weighted axial image showing a normal AITFL (arrow) attached to avulsion fragments of the distal fibula.
Subsequent ankle arthroscopy showed a complete tear of the left AITFL.
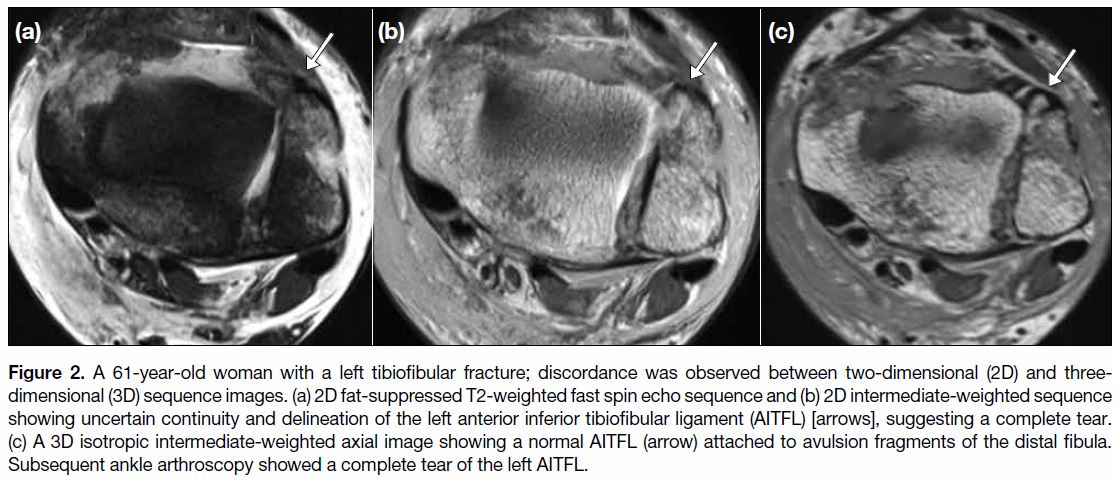
Figure 3. A 42-year-old woman with a left ankle fracture; concordance was shown between two-dimensional (2D) and three-dimensional
(3D) sequence images. (a) 2D fat-suppressed T2-weighted fast spin echo sequence, (b) 2D intermediate-weighted sequence, and (c) 3D
isotropic intermediate-weighted axial images showing a thinned contour of the PITFL (posterior inferior tibiofibular ligament), suggesting a
tear (arrows). (d) An intrasubstance partial tear of the left PITFL is noted on arthroscopy (star).
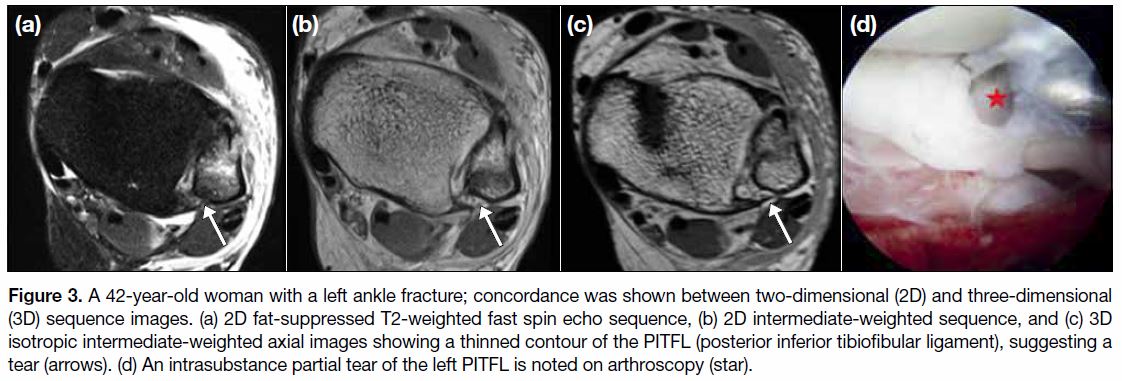
Figure 4. A 44-year-old woman with a left ankle fracture; concordance is observed between two-dimensional (2D) and three-dimensional
(3D) sequence images. (a) 2D fat-suppressed T2-weighted fast spin echo axial and (b) coronal, and (c) 3D isotropic intermediate-weighted
axial and (d) coronal images showing waviness and uncertain continuity of the left transverse tibiofibular ligament (TrTFL) [arrows], indicating
a possible complete tear. Subsequent ankle arthroscopy showed a complete tear of the left TrTFL.
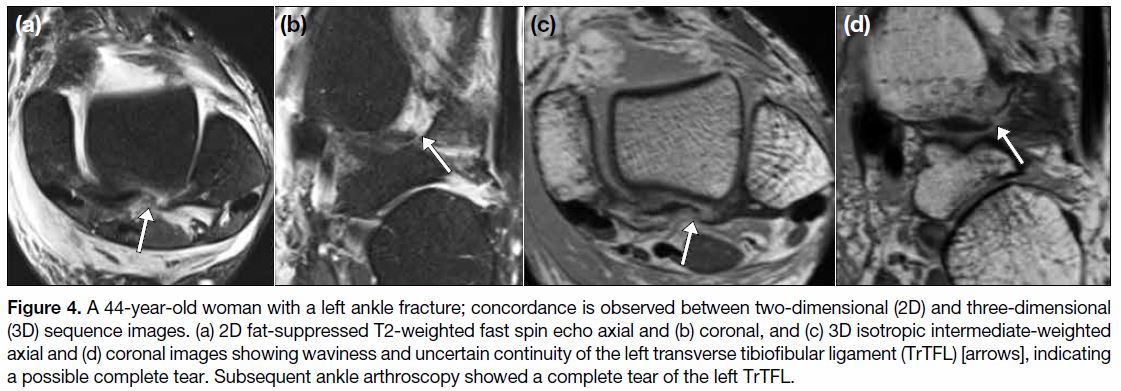
Table 4. Sensitivity, specificity, and accuracy for each syndesmotic ligament injury.
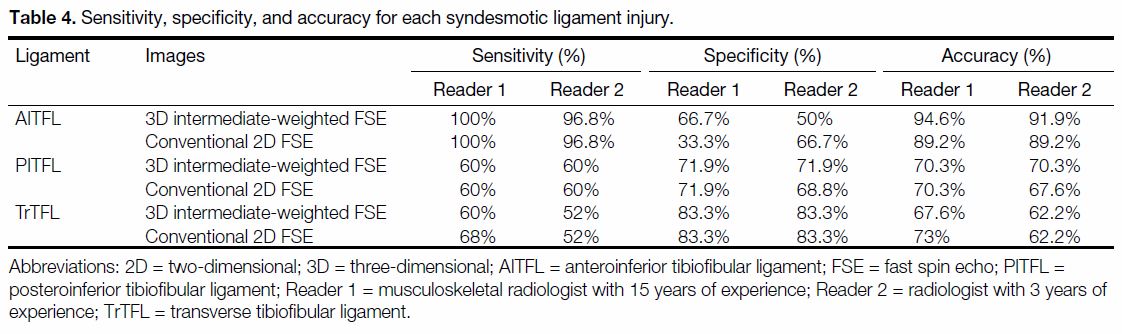
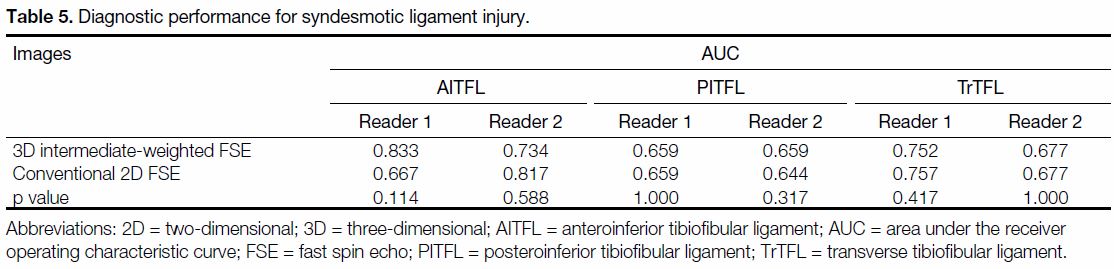
Table 5 summarises the estimated AUC values for
diagnostic performance for syndesmotic ligament
injury. For both readers, the accuracy of interpretation of
PITFL injuries was higher for the 3D isotropic
intermediate-weighted T2 FSE images than for the 2D
T2-weighted FSE images. The accuracy of diagnosing
AITFL and TrTFL was slightly higher with conventional
2D FSE for one of the readers, but the difference was not
statistically significant.
Table 5. Diagnostic performance for syndesmotic ligament injury.
There was good interobserver agreement in assessments
of the syndesmotic ligaments, with substantial agreement
for the AITFL (κ = 0.631) and TrTFL (κ = 0.728) and
almost perfect agreement for the PITFL (κ = 0.847).
DISCUSSION
According to arthroscopic findings, the most commonly
injured ligament of the distal tibiofibular syndesmosis in
ankle fractures was the AITFL (83.8%). AITFL is the
weakest of the four syndesmotic ligaments and is the first
to yield to forces that create an external rotation of the
fibula around its longitudinal axis.
Conventional 2D FSE ankle MRI sequences include
separate orthogonal scan planes, which increases the
scan time. Recently, high-resolution 3D FSE sequences
have improved soft tissue contrast and allowed 3D
reformation in arbitrary orientations. Previously, 3D
MRI could not replace 2D MRI because its soft tissue
contrast was unsatisfactory. In this study, we confirmed
that 3D images are not inferior to 2D images when
diagnosing ruptures of the syndesmotic ligaments of
the ankle. If further studies continue to reveal that 3D
images are comparable to 2D images for other ligaments or ankle injuries, it will be possible to substitute 3D MRI
for 2D MRI, which will reduce the scan time.
A previous study by Kim et al[13] reported that the
performance of MRI with 3D SPACE (sampling
perfection with application-optimised contrasts using
different flip angle evolution) sequences was better than
that of 2D axial and coronal proton density-weighted
magnetic resonance images for the diagnosis of acute
and chronic syndesmosis injuries, including the AITFL
and PITFL. Previous studies examining the anterior talofibular ligament[14] and calcaneofibular ligament[15]
have also shown comparable diagnostic performance of
3D and 2D MRI.
However, no study has compared the performance of 3D
isotropic intermediate-weighted FSE imaging with that
of conventional 2D MRI of the syndesmotic ligaments
for the diagnostic evaluation of ankle fractures, including
AITFL, PITFL, and TrTFL. We found no statistically
significant difference in the diagnostic performance of
the 3D isotropic intermediate-weighted FSE sequences
compared with that of the conventional 2D FSE
sequences with regard to syndesmotic ligament injuries
associated with ankle fracture. These results, although
similar to those of previous studies, will be helpful in
shaping future ankle MRI protocols.
The present study has some limitations. First, selection
bias may have occurred. This study included surgically
confirmed cases of ankle fracture and excluded patients
with mild injuries. In addition, we did not include a
control group without ankle joint problems. However,
it was necessary to exclude healthy volunteers because
healthy people cannot be subjected to invasive ankle
arthroscopy. Second, this is a retrospective study, and the
surgeons were not blinded to the MRI features prior to
surgery. Third, the present study showed relatively low
sensitivity and accuracy for PITFL and TrTFL. There
were few PITFL injuries, most likely because PITFL is
a thick, strong ligament. TrTFL is a thin structure and is
difficult to evaluate on MRI.
CONCLUSION
3D isotropic intermediate-weighted FSE MRI of the
ankle resulted in no statistically significant difference in
diagnostic performance compared to 2D T2-weighted
FSE MRI when evaluating the syndesmotic ligaments.
The 3D MRI sequences can be considered for
syndesmotic ligament injury instead of 2D images, with
shortened acquisition time.
REFERENCES
1. Fong DT, Man CY, Yung PS, Cheung SY, Chan KM. Sport-related
ankle injuries attending an accident and emergency department. Injury. 2008;39:1222-7. Crossref
2. Porter DA, Jaggers RR, Barnes AF, Rund AM. Optimal
management of ankle syndesmosis injuries. Open Access J Sports
Med. 2014;5:173-82. Crossref
3. Waterman BR, Belmont PJ, Cameron KL, Svoboda SJ, Alitz CJ,
Qwens BD. Risk factors for syndesmotic and medial ankle sprain:
the role of sex, sport and level of competition. Am J Sports Med.
2011;39:992-8. Crossref
4. Press CM, Gupta A, Hutchinson MR. Management of ankle
syndesmosis injuries in the athlete. Curr Sports Med Rep.
2009;8:228-33. Crossref
5. Jung JY, Jee WH, Park MY, Lee SY, Kim YS. Supraspinatus
tendon tears at 3.0 T shoulder MRI arthrography: diagnosis with 3D
isotropic turbo spin echo SPACE sequence versus 2D conventional
sequences. Skeletal Radiol. 2012;41:1401-10. Crossref
6. Kijowski R, Davis KW, Woods MA, Lindstrom MJ, De Smet AA,
Gold GE, et al. Knee joint: comprehensive assessment with
3D isotropic resolution fast spin-echo MR imaging diagnostic
performance compared with that of conventional MR imaging at
3.0 T. Radiology. 2009;252:486-95. Crossref
7. Stevens KJ, Busse RF, Han E, Brau AC, Beatty PJ, Beaulieu CF,
et al. Ankle: isotropic MR imaging with 3D-FSE-cubedinitial
experience in healthy volunteers. Radiology. 2008;249:1026-
33. Crossref
8. Gold GE, Busse RF, Beehler C, Han E, Brau AC, Beatty PJ, et al.
Isotropic MRI of the knee with 3D fast spin-echo extended echotrain
acquisition (XETA): initial experience. AJR Am J Roentgenol.
2007;188:1287-93. Crossref
9. Subhas N, Kao A, Freire M, Polster JM, Obuchowski NA,
Winalski CS. MRI of the knee ligaments and menisci: comparison
of isotropic-resolution 3D and conventional 2D fast spin-echo
sequences at 3 T. AJR Am J Roentgenol. 2011;197:442-50. Crossref
10. DeLong ER, DeLong DM, Clarke-Pearson DL. Comparing the
areas under two or more correlated receiver operating characteristic
curves: a nonparametric approach. Biometrics. 1988;44:837-45. Crossref
11. Park SH, Goo JM, Jo CH. Receiver operating characteristic (ROC)
curve: practical review for radiologists. Korean J Radiol. 2004;5:11-8. Crossref
12. Landis JR, Koch GG. The measurement of observer agreement for
categorical data. Biometrics. 1977;33:159-74. Crossref
13. Kim M, Choi YS, Jeong MS, Park M, Chun TJ, Kim JS, et al.
Comprehensive assessment of ankle syndesmosis injury using
3d isotropic turbo spin-echo sequences: diagnostic performance
compared with that of conventional and oblique 3-T MRI. AJR
Am J Roentgenol. 2017;208:827-33. Crossref
14. Yi J, Cha JG, Lee YK, Lee BR, Jeon CH. MRI of the anterior
talofibular ligament, talar cartilage and os subfibulare: comparison
of isotropic resolution 3D and conventional 2D T2-weighted fast
spin-echo sequences at 3.0 T. Skeletal Radiol. 2016;45:899-908. Crossref
15. Park HJ, Lee SY, Choi YJ, Hong HP, Park SJ, Park JH, et al.
3D isotropic T2-weighted fast spin echo (VISTA) versus 2D
T2-weighted fast spin echo in evaluation of the calcaneofibular
ligament in the oblique coronal plane. Clin Radiol. 2017;72:176.
e1-7. Crossref